

Question: data is too large 2. The Excel le Wagefull contains data on hourly wages and other variables for 3296 working individuals. a) Draw a histogram
data is too large
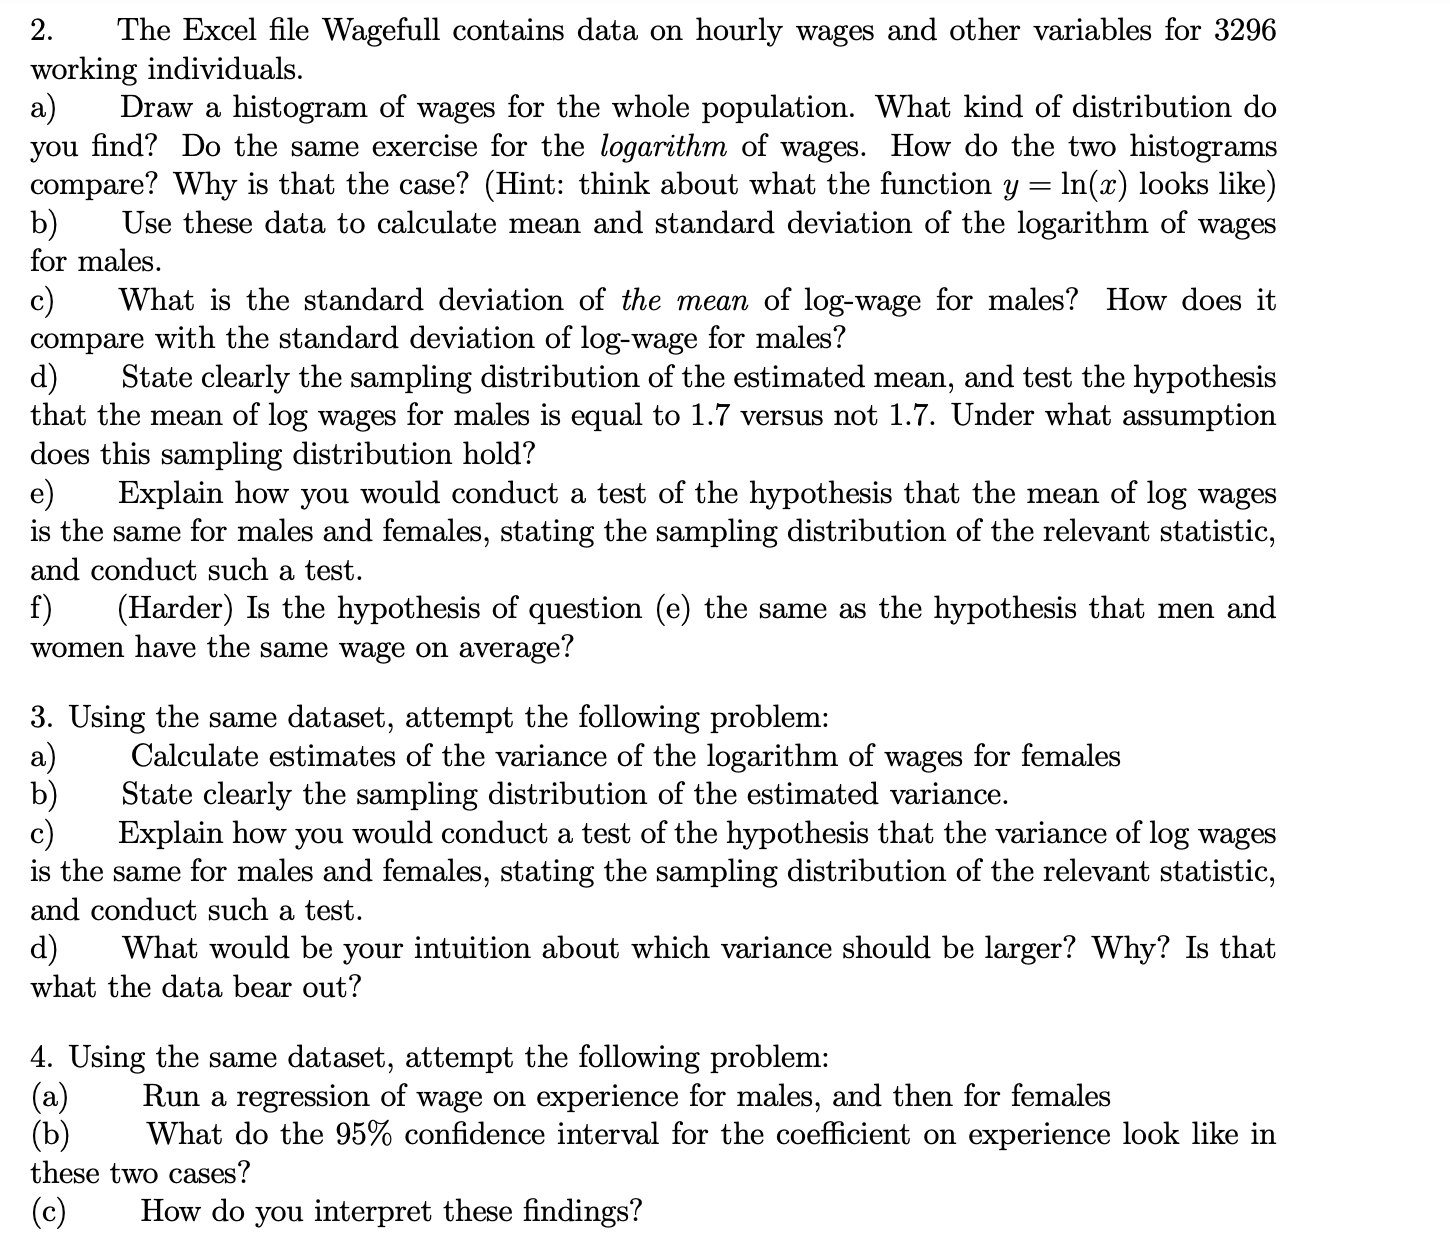
2. The Excel le Wagefull contains data on hourly wages and other variables for 3296 working individuals. a) Draw a histogram of wages for the whole population. What kind of distribution do you nd? Do the same exercise for the logarithm of wages. How do the two histograms compare? Why is that the case? (Hint: think about what the function y = ln(;r.) looks like) b) Use these data to calculate mean and standard deviation of the logarithm of wages for males. 0) What is the standard deviation of the mean of logwage for males? How does it compare with the standard deviation of logwage for males? d) State clearly the sampling distribution of the estimated mean, and test the hypothesis that the mean of log wages for males is equal to 1.7 versus not 1.7. Under what assumption does this sampling distribution hold? e) Explain how you would conduct a test of the hypothesis that the mean of log wages is the same for males and females, stating the sampling distribution of the relevant statistic, and conduct such a test. f) (Harder) Is the hypothesis of question (e) the same as the hypothesis that men and women have the same wage on average? 3. Using the same dataset, attempt the following problem: a) Calculate estimates of the variance of the logarithm of wages for females b) State clearly the sampling distribution of the estimated variance. 0) Explain how you would conduct a test of the hypothesis that the variance of log wages is the same for males and females, stating the sampling distribution of the relevant statistic, and conduct such a test. d) What would be your intuition about which variance should be larger? Why? Is that what the data bear out? 4. Using the same dataset, attempt the following problem: (a) Run a regression of wage on experience for males, and then for females (b) What do the 95% condence interval for the coeicient on experience look like in these two cases? (c) How do you interpret these ndings
Step by Step Solution
There are 3 Steps involved in it

Get step-by-step solutions from verified subject matter experts