

Question: Data Management Average age Average words per minute 6 82 119 8 135 9 152 10 167 11 177 a) Draw a scatter plot manually
Data Management
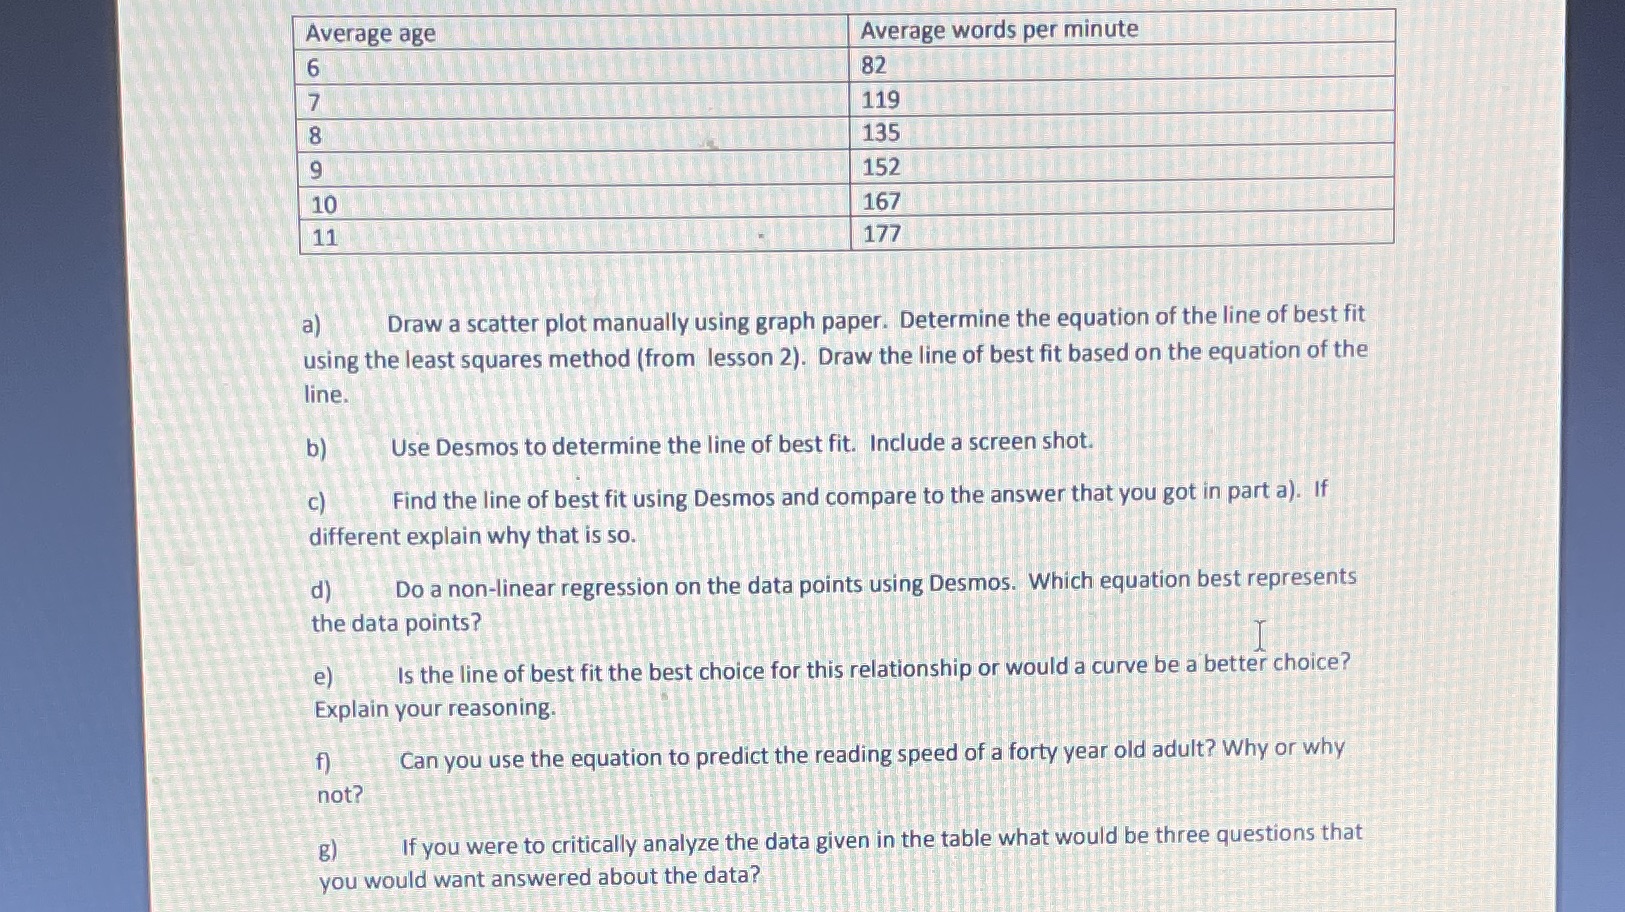
Average age Average words per minute 6 82 119 8 135 9 152 10 167 11 177 a) Draw a scatter plot manually using graph paper. Determine the equation of the line of best fit using the least squares method (from lesson 2). Draw the line of best fit based on the equation of the line. b) Use Desmos to determine the line of best fit. Include a screen shot. C) Find the line of best fit using Desmos and compare to the answer that you got in part a). If different explain why that is so. d) Do a non-linear regression on the data points using Desmos. Which equation best represents the data points? e) Is the line of best fit the best choice for this relationship or would a curve be a better choice? Explain your reasoning. f) Can you use the equation to predict the reading speed of a forty year old adult? Why or why not? g) If you were to critically analyze the data given in the table what would be three questions that you would want answered about the data
Step by Step Solution
There are 3 Steps involved in it

Get step-by-step solutions from verified subject matter experts