

Question: Data Mining R Use the Boston Housing Data. This data can be accessed in the MASS package (available through CRAN). > library(MASS) > data(Boston) a)
Data Mining R
Use the Boston Housing Data. This data can be accessed in the MASS package (available through CRAN). > library(MASS) > data(Boston)
a) Visualize the data using histograms of the different variables in the data set. Transform the data into a binary incidence matrix, and justify the choices you make in grouping categories.
b) Visualize the data using the itemFrequencyPlot in the arules package. Apply the apriori algorithm (Do not forget to specify parameters in your write up).
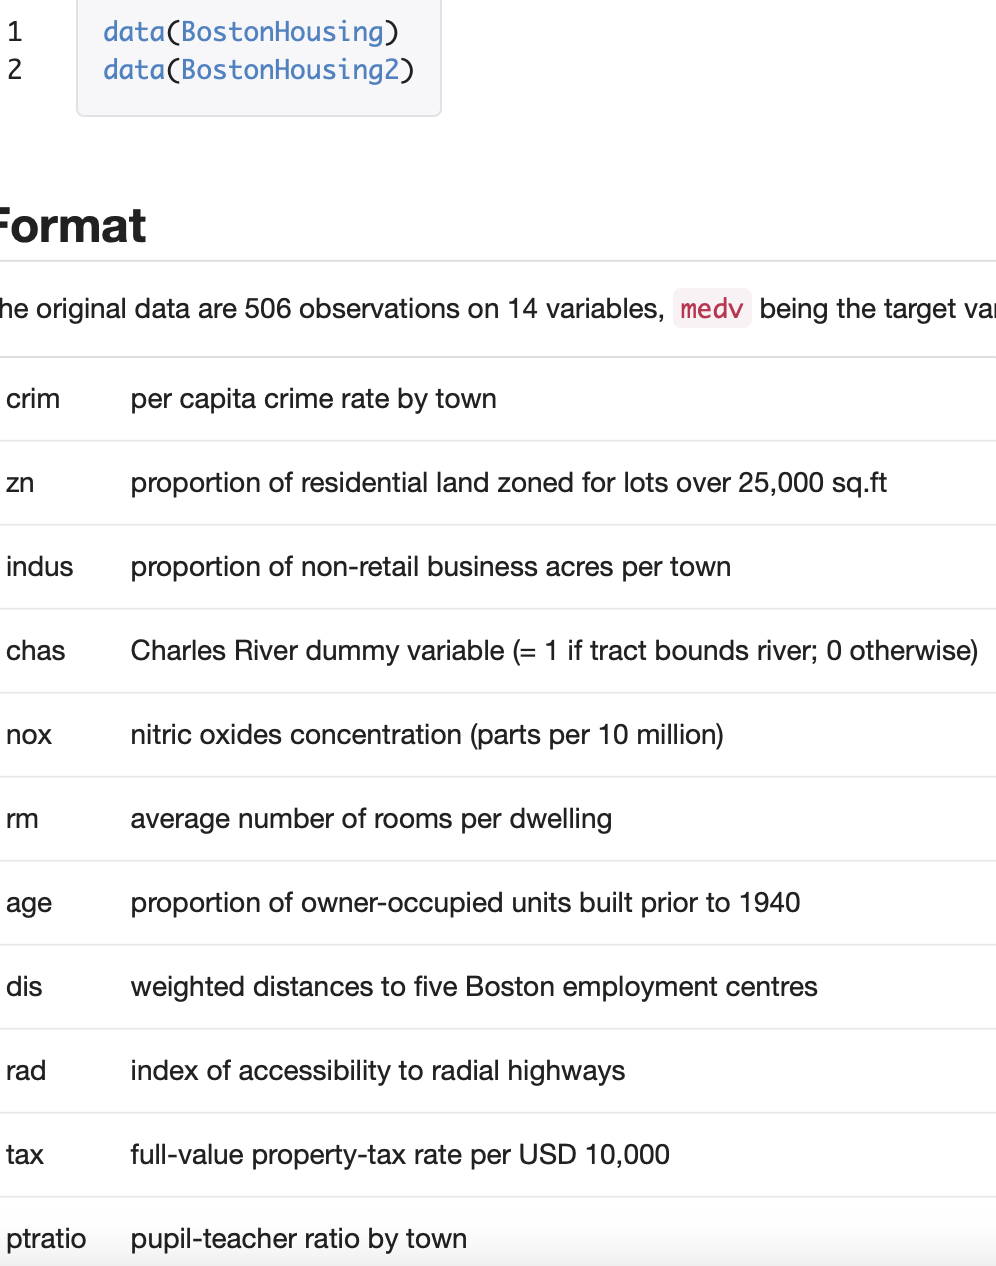
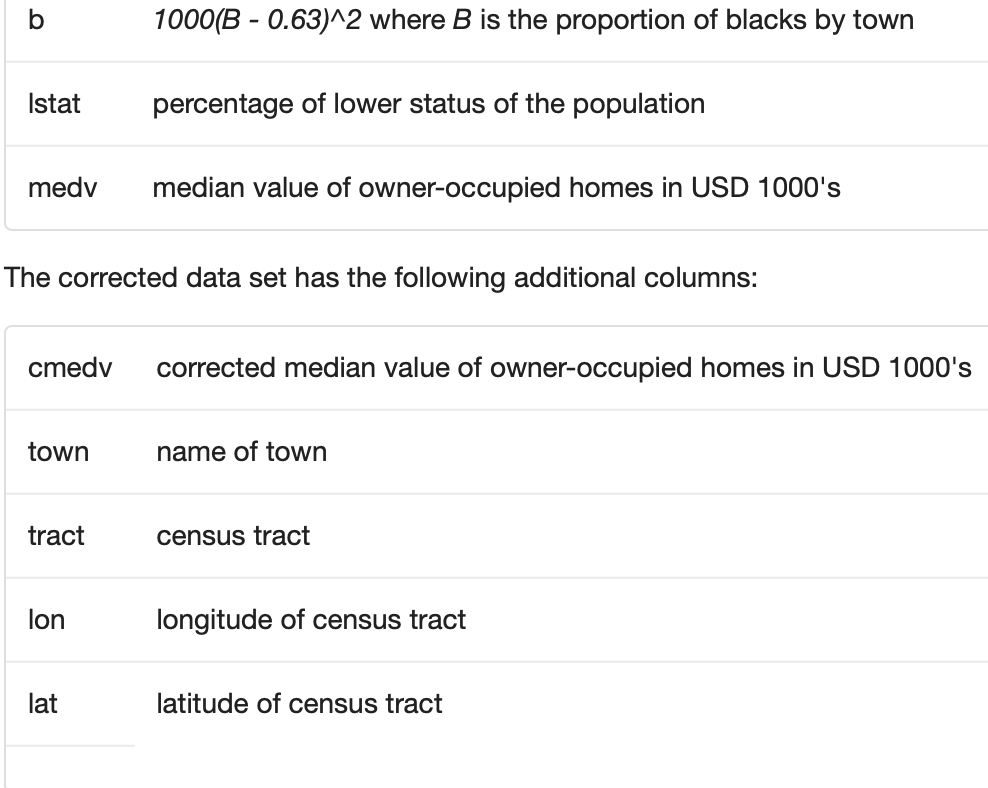
1 data(BostonHousing) data(BostonHousing2) 2 Format he original data are 506 observations on 14 variables, medv being the target va crim per capita crime rate by town zn proportion of residential land zoned for lots over 25,000 sq.ft indus proportion of non-retail business acres per town chas Charles River dummy variable (= 1 if tract bounds river; 0 otherwise) nox nitric oxides concentration (parts per 10 million) rm average number of rooms per dwelling age proportion of owner-occupied units built prior to 1940 dis weighted distances to five Boston employment centres rad index of accessibility to radial highways tax full-value property-tax rate per USD 10,000 ptratio pupil-teacher ratio by town b 1000(B - 0.63)^2 where B is the proportion of blacks by town Istat percentage of lower status of the population medy median value of owner-occupied homes in USD 1000's The corrected data set has the following additional columns: cmedy corrected median value of owner-occupied homes in USD 1000's town name of town tract census tract lon longitude of census tract lat latitude of census tract 1 data(BostonHousing) data(BostonHousing2) 2 Format he original data are 506 observations on 14 variables, medv being the target va crim per capita crime rate by town zn proportion of residential land zoned for lots over 25,000 sq.ft indus proportion of non-retail business acres per town chas Charles River dummy variable (= 1 if tract bounds river; 0 otherwise) nox nitric oxides concentration (parts per 10 million) rm average number of rooms per dwelling age proportion of owner-occupied units built prior to 1940 dis weighted distances to five Boston employment centres rad index of accessibility to radial highways tax full-value property-tax rate per USD 10,000 ptratio pupil-teacher ratio by town b 1000(B - 0.63)^2 where B is the proportion of blacks by town Istat percentage of lower status of the population medy median value of owner-occupied homes in USD 1000's The corrected data set has the following additional columns: cmedy corrected median value of owner-occupied homes in USD 1000's town name of town tract census tract lon longitude of census tract lat latitude of census tract
Step by Step Solution
There are 3 Steps involved in it

Get step-by-step solutions from verified subject matter experts