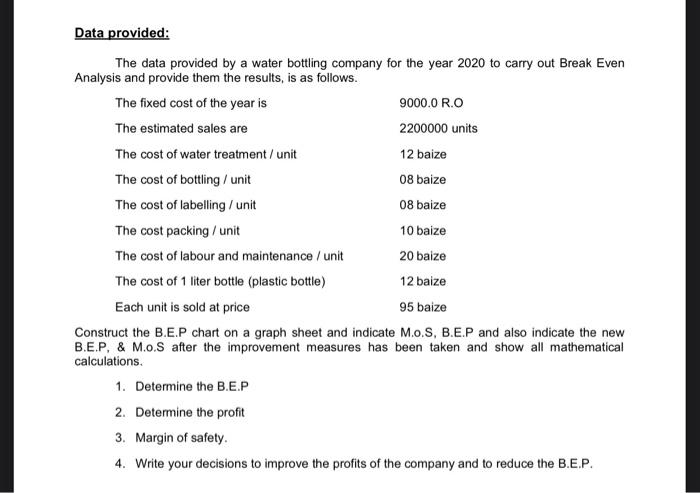
Question: Data provided: The data provided by a water bottling company for the year 2020 to carry out Break Even Analysis and provide them the results,

Data provided: The data provided by a water
Data provided: The data provided by a water bottling company for the year 2020 to carry out Break Even Analysis and provide them the results, is as follows. The fixed cost of the year is 9000.0 R.O The estimated sales are 2200000 units The cost of water treatment/ unit 12 baize The cost of bottling / unit 08 baize The cost of labelling / unit 08 baize The cost packing/ unit 10 baize The cost of labour and maintenance / unit 20 baize The cost of 1 liter bottle (plastic bottle) 12 baize Each unit is sold at price 95 baize Construct the B.E.P chart on a graph sheet and indicate M.O.S, B.E.P and also indicate the new B.E.P. & M.O.S after the improvement measures has been taken and show all mathematical calculations. 1. Determine the B.E.P 2. Determine the profit 3. Margin of safety 4. Write your decisions to improve the profits of the company and to reduce the B.E.P. Objective: Data provided: An investment proposal involves an expenditure of 150,000 Ro at the start of the project. The income from the project at the end of each year for 6 years is 70,000 RO, 60,000 RO, 50,000 Ro, 75,000 Ro, 65000 Ro and 50,000 Ro. The maintenance will cost 4000 Ro for the first year and it increments by 15 % every year. The salvage value is 40000 Ro. Draw a CFD for the project and give the analysis. Procedure: Diagram/Graph

Step by Step Solution

There are 3 Steps involved in it

1 Expert Approved Answer
Step: 1 Unlock blur-text-image
Question Has Been Solved by an Expert!

Get step-by-step solutions from verified subject matter experts

Step: 2 Unlock
Step: 3 Unlock

Students Have Also Explored These Related General Management Questions!