

Question: Data set 3 Sinusoidal Set The data set below describes the average low temperature for Pine Bluff, All from January to December 2015. K iv
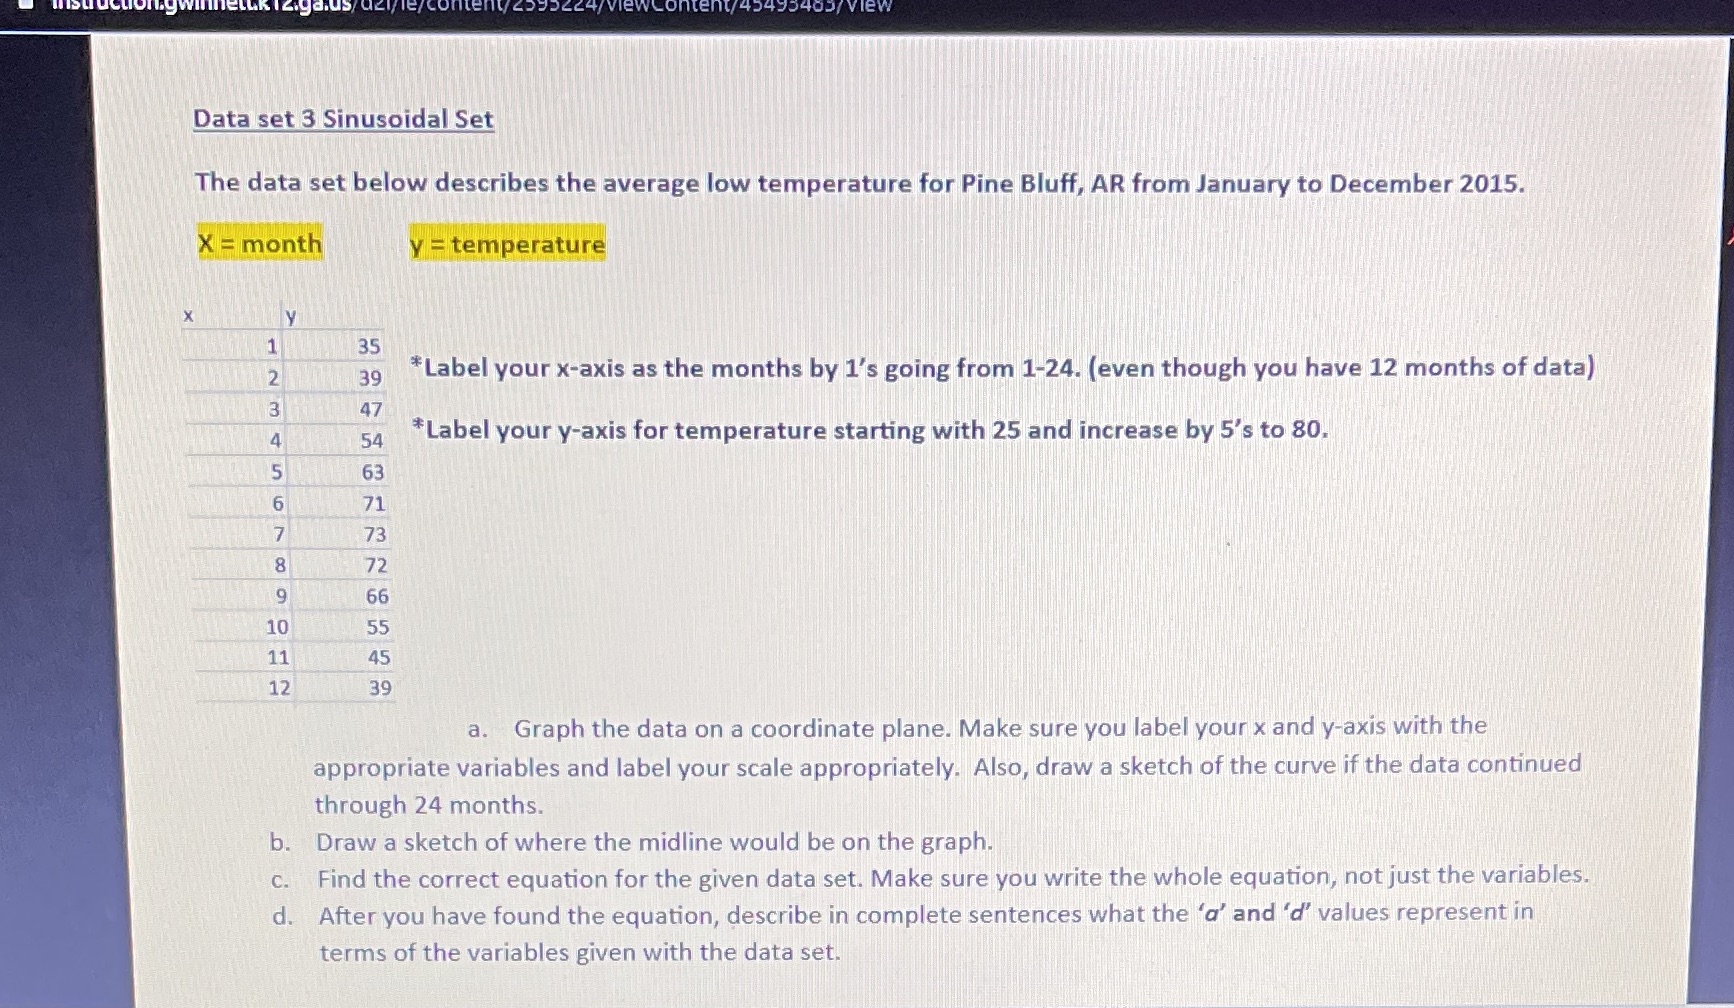
Data set 3 Sinusoidal Set The data set below describes the average low temperature for Pine Bluff, All from January to December 2015. K iv ' 17'. _ 35 ' ' '2' ' ' \"59 *Label your x-axis as the months by 1's going from 1'24. (even though you haVe 12 months of data] \" m'i'" \"" ":2 *Label your yaxis for temperature starting with 25 and increase by 5': to 80. 51' 7 63 61 7 , 11 7... m- "32. e \".55..-. _ .72 9 66 10 55 .11. ._ _..4E 12_ 39 a. Graph the data on a coordinate plane. Make sure you label yourx and waxis with the appropriate variables and label your scale appropriately. Also, draw a sketch of the curve if the data continued through 24 months. b. Draw a sketch of where the midline would be on the graph. .Find the correct equation for the given data set. Make sure you write the whole equation, not just the variables. After you have found the equation, describe in complete sentences what the 'a' and 'a" values represent in terms of the variables given with the data set. P
Step by Step Solution
There are 3 Steps involved in it

Get step-by-step solutions from verified subject matter experts