

Question: Data Set is provided in the Comments, kindly check it. You are interested to predict the Fare ($) from the Distance (km). As a first
Data Set is provided in the Comments, kindly check it.
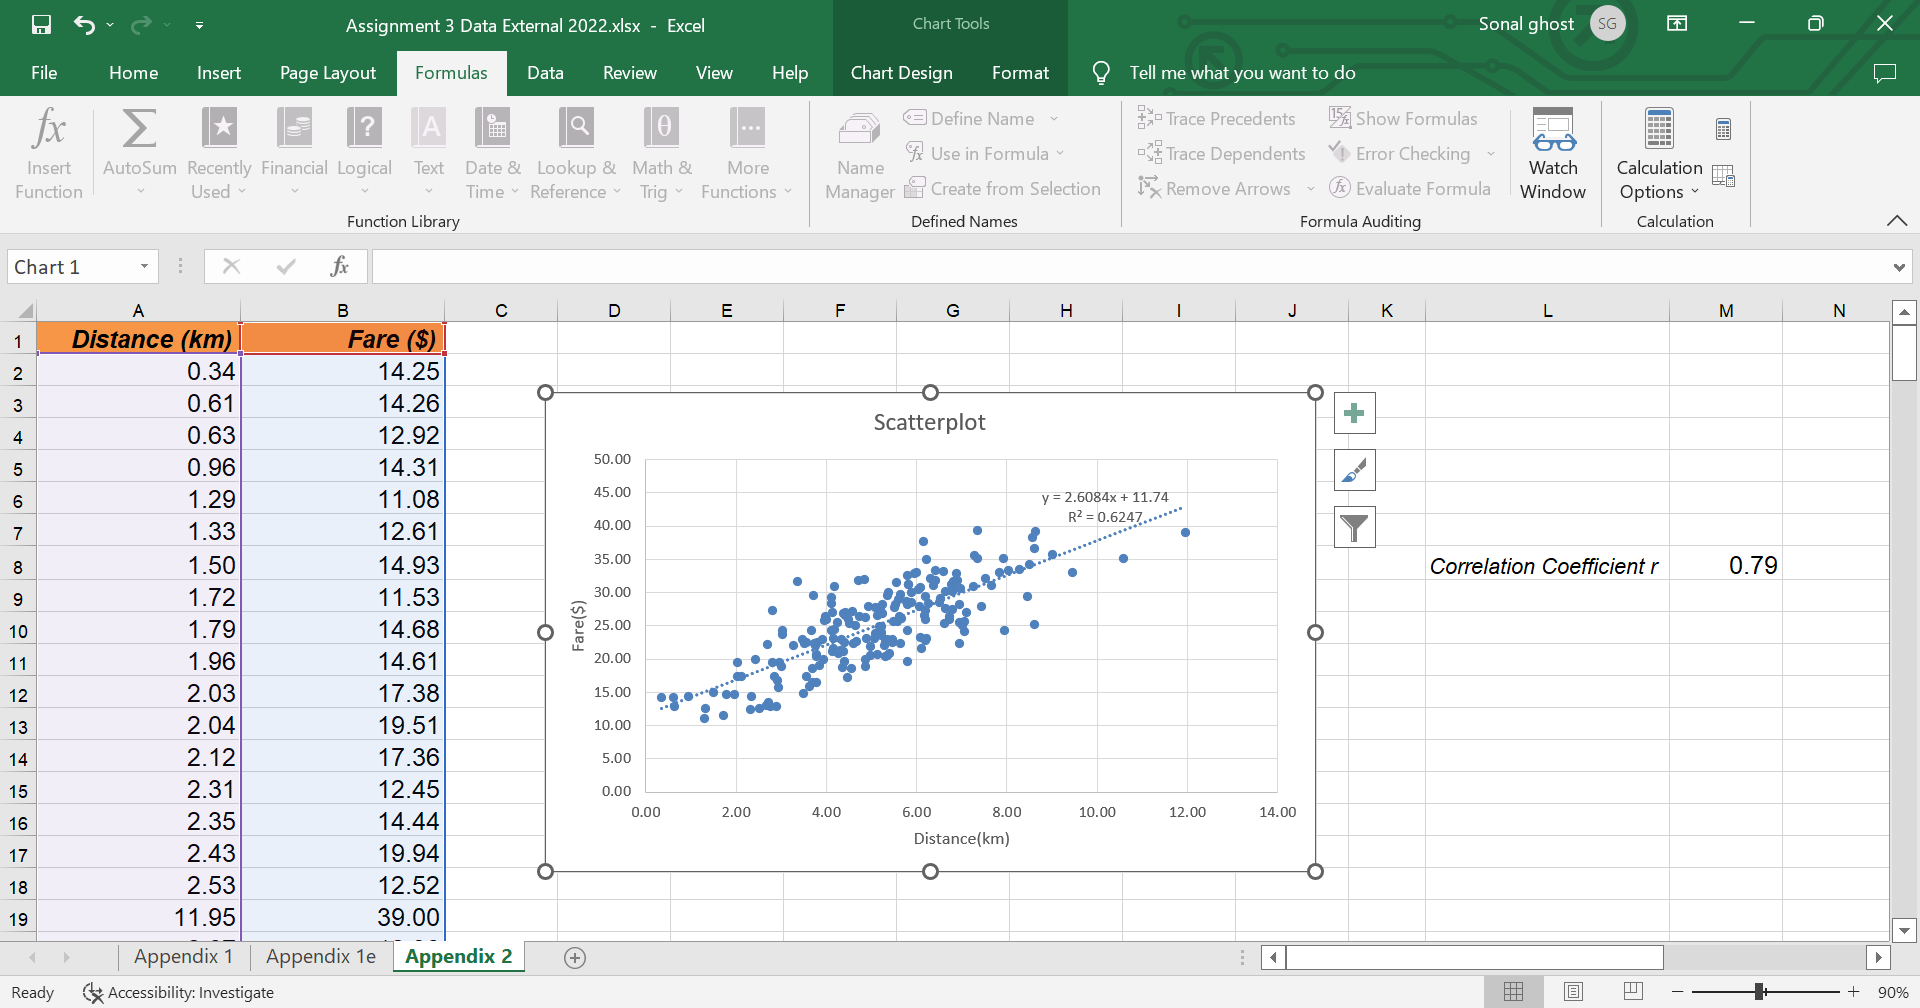
You are interested to predict the Fare ($)from the Distance (km).As a first step, use EXCEL to draw a scatterplot of Distance(km)vs Fare ($). Annotate the axes of this plot and include a title that is meaningful and contains your network ID.
- Compute the correlation between these two variables using the CORREL function. In this Word document, type the Excel calculation you performed to compute the correlation coefficient.
- Using EXCEL add a trendline to the scatterplot and display the regression equation and coefficient of determination (R-squared value).
- Comment briefly on the scatterplot and correlation coefficient and whether a linear model is appropriate for this data.
- (2 marks) State which is the dependent variable and which is the independent variable.
- (3 marks) Discuss the value of the intercept and whether it is meaningful. Also, what does the slope measure in this scenario?
- (3 marks) What is the value of the coefficient of determination (R-squared value)? Briefly discuss what the value means and whether the model is a good fit for the data.
- (4 marks) Use the simple regression equation from part (a) to predict the Fare ($)required when the Distance (km) travelled is 5km. Comment on the accuracy of the prediction and discuss briefly.
- (4 marks) Use the simple regression equation from part (a) to predict the Fare ($) when the Distance (km) travelled is 13km. Comment on the accuracy of the prediction and discuss briefly.
Assignment 3 Data External 2022.xlsx - Excel Chart Tools Sonal ghost SG X File Home Insert Page Layout Formulas Data Review View Help Chart Design Format Tell me what you want to do C fx ? A Q Define Name " Trace Precedents 45% Show Formulas Insert AutoSum Recently Financial Logical Text Date & Lookup & Math & of Use in Formula by+ Trace Dependents More Name Error Checking Watch Calculation Function Used Time ~ Reference . Trig . Functions Manager Create from Selection Remove Arrows ~ fx) Evaluate Formula Window Options Function Library Defined Names Formula Auditing Calculation Chart 1 X V A B C D E F G H J K L M N A Distance (km) Fare ($) 0.34 14.25 W N 0.61 14.26 O O O 0.63 12.92 Scatterplot 0.96 14.31 50.00 1.29 11.08 45.00 y = 2.6084x + 11.74 1.33 12.61 40.00 R2 = 0.6247......"" ................" 1.50 14.93 35.00 Correlation Coefficient r 0.79 40 00 1.72 11.53 30.00 10 1.79 14.68 Fare($) O 25.00 O 11 1.96 14.61 20.00 12 2.03 17.38 15.00 13 2.04 19.51 10.00 14 2.12 17.36 5.00 15 2.31 12.45 0.00 16 2.35 14.44 0.00 2.00 4.00 6.00 8.00 10.00 12.00 14.00 17 2.43 Distance(km) 19.94 O 18 2.53 12.52 19 11.95 39.00 Appendix 1 Appendix le Appendix 2 + Ready Accessibility: Investigate + 90%
Step by Step Solution
There are 3 Steps involved in it

Get step-by-step solutions from verified subject matter experts