

Question: DATA SET Stalk Length (cm) Root Length (cm) Leaf Count Plant 1 10.1 4.4 35 Plant 2 21.55 8.2 27 Plant 3 21.7 5.5 40
DATA SET Stalk Length (cm) Root Length (cm) Leaf Count Plant 1 10.1 4.4 35 Plant 2 21.55 8.2 27 Plant 3 21.7 5.5 40 Plant 4 18.6 4.2 42 Plant 5 19.5 6 38 Plant 6 18.5 5 36 Plant 7 17 5 39 Plant 8 18.6 5.1 45 Plant 9 17.8 5.2 26 Plant 10 17.3 5.2 37 Plant 11 17.6 6.2 41 Plant 12 11.7 2.8 40 Plant 13 21 5 42 Plant 14 18.1 6.1 23 Plant 15 21 6.2 33 Plant 16 17.2 2.8 46 Plant 17 15.45 2.7 40 Plant 18 17.1 2.5 34 Plant 19 21 4.9 36 Plant 20 13.65 2.5 35 Plant 21 16.5 6.35 21 Plant 22 20.2 3.8 35 Plant 23 18.6 5.3 41 Plant 24 22 6.4 36 Plant 25 19.7 5.5 9 Plant 26 17.8 3.7 43 Plant 27 21 6.2 36 Plant 28 17.8 5.6 45 Plant 29 18.2 6 24 Plant 30 18.5 4.7 38
PART D ONLY PLEASE
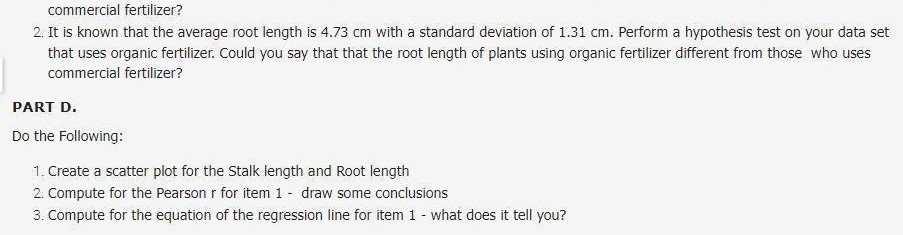
commercial fertilizer? 2. It is known that the average root length is 4.73 cm with a standard deviation of 1.31 cm. Perform a hypothesis test on your data set that uses organic fertilizer. Could you say that that the root length of plants using organic fertilizer different from those who uses commercial fertilizer? PART D. Do the Following: 1. Create a scatter plot for the Stalk length and Root length 2. Compute for the Pearson r for item 1 - draw some conclusions 3. Compute for the equation of the regression line for item 1 - what does it tell you
Step by Step Solution
There are 3 Steps involved in it

Get step-by-step solutions from verified subject matter experts