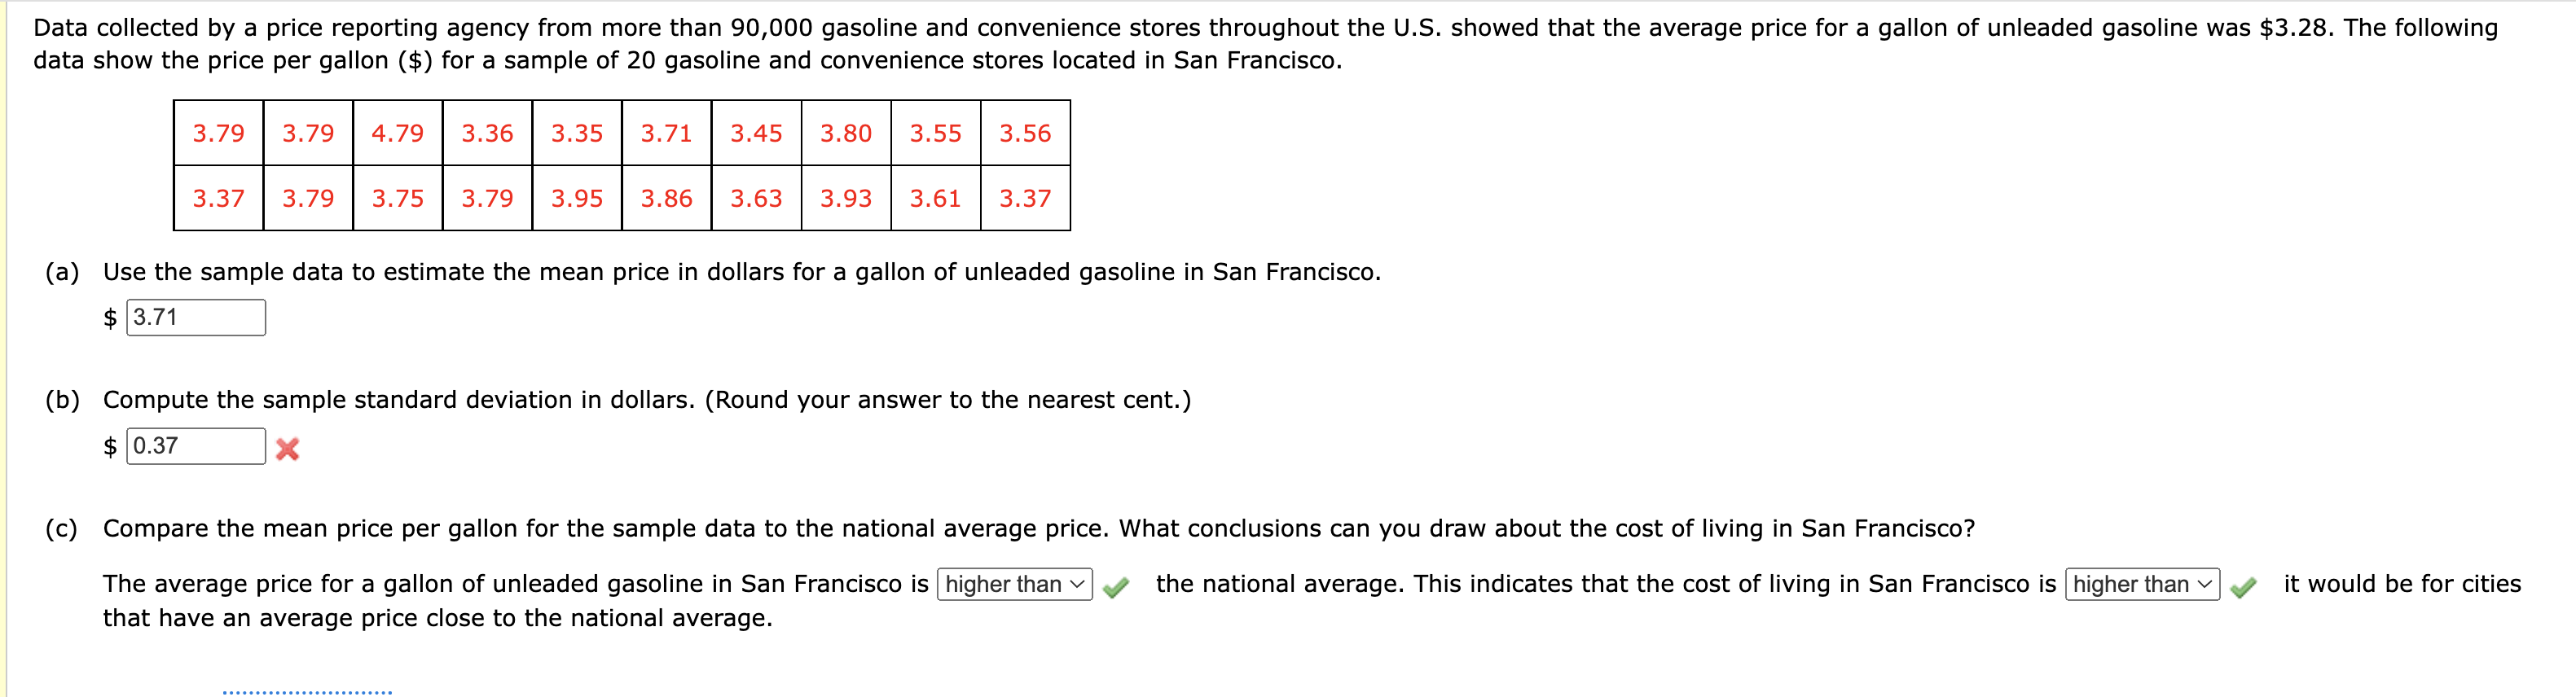
Question: data show the price per gallon ($) for a sample of 20 gasoline and convenience stores located in San Francisco. (a) Use the sample data

data show the price per gallon (\$) for a sampledata show the price per gallon (\$) for a sample

data show the price per gallon (\$) for a sample of 20 gasoline and convenience stores located in San Francisco. (a) Use the sample data to estimate the mean price in dollars for a gallon of unleaded gasoline in San Francisco. $ (b) Compute the sample standard deviation in dollars. (Round your answer to the nearest cent.) that have an average price close to the national average. There are n=10 observations for each age group. Use the given data to compute each mean. Compute the mean for the 18-34 age group. x=nxi=101,405+265+1,606+2,195+1,671+1,144+2,087+1,250++1,440=$ Compute the mean for the 35-44 age group. x=nxi=101,019+484++1,650+1,427+1,106+1,972+1,500+1,736+1,465=$ Compute the mean for the 45 and older age group. x=nxi=101,150+966+415+1,389+1,249+840++1,197+1,320+1,515

Step by Step Solution

There are 3 Steps involved in it

1 Expert Approved Answer
Step: 1 Unlock blur-text-image
Question Has Been Solved by an Expert!

Get step-by-step solutions from verified subject matter experts

Step: 2 Unlock
Step: 3 Unlock

Students Have Also Explored These Related General Management Questions!