

Question: Data shown in table is from a paper describing the growth of Ehrilch Ascites tumours in mice. Tumour size peaks at day 11, which (plus
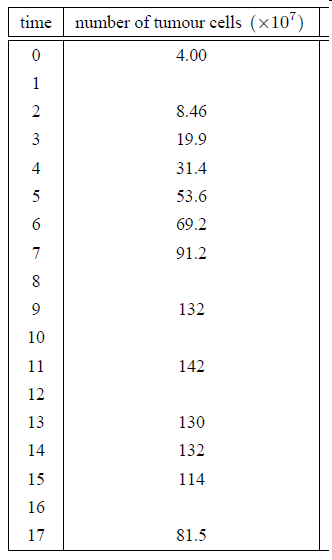
Data shown in table is from a paper describing the growth of Ehrilch Ascites tumours in mice.
Tumour size peaks at day 11, which (plus 1) gives a value that we will use for
Fit a logistic equation to the relevant data and estimate the tumour sizes at the missing times
Please show steps and neat work for a good rating !!
time number of tumour cells (x107) 0 4.00 1 2 8.46 3 19.9 4 5 31.4 53.6 69.2 91.2 6 7 8 9 132 10 11 142 12 13 130 14 132 15 114 16 17 81.5 time number of tumour cells (x107) 0 4.00 1 2 8.46 3 19.9 4 5 31.4 53.6 69.2 91.2 6 7 8 9 132 10 11 142 12 13 130 14 132 15 114 16 17 81.5
Step by Step Solution
There are 3 Steps involved in it
1 Expert Approved Answer
Step: 1 Unlock

Question Has Been Solved by an Expert!
Get step-by-step solutions from verified subject matter experts
Step: 2 Unlock
Step: 3 Unlock