

Question: Data Table 1: T Spring Strength 1 Spring Strength 4 Spring Strength 10 Analysis: Plot the Force versus distance graph for each spring on the
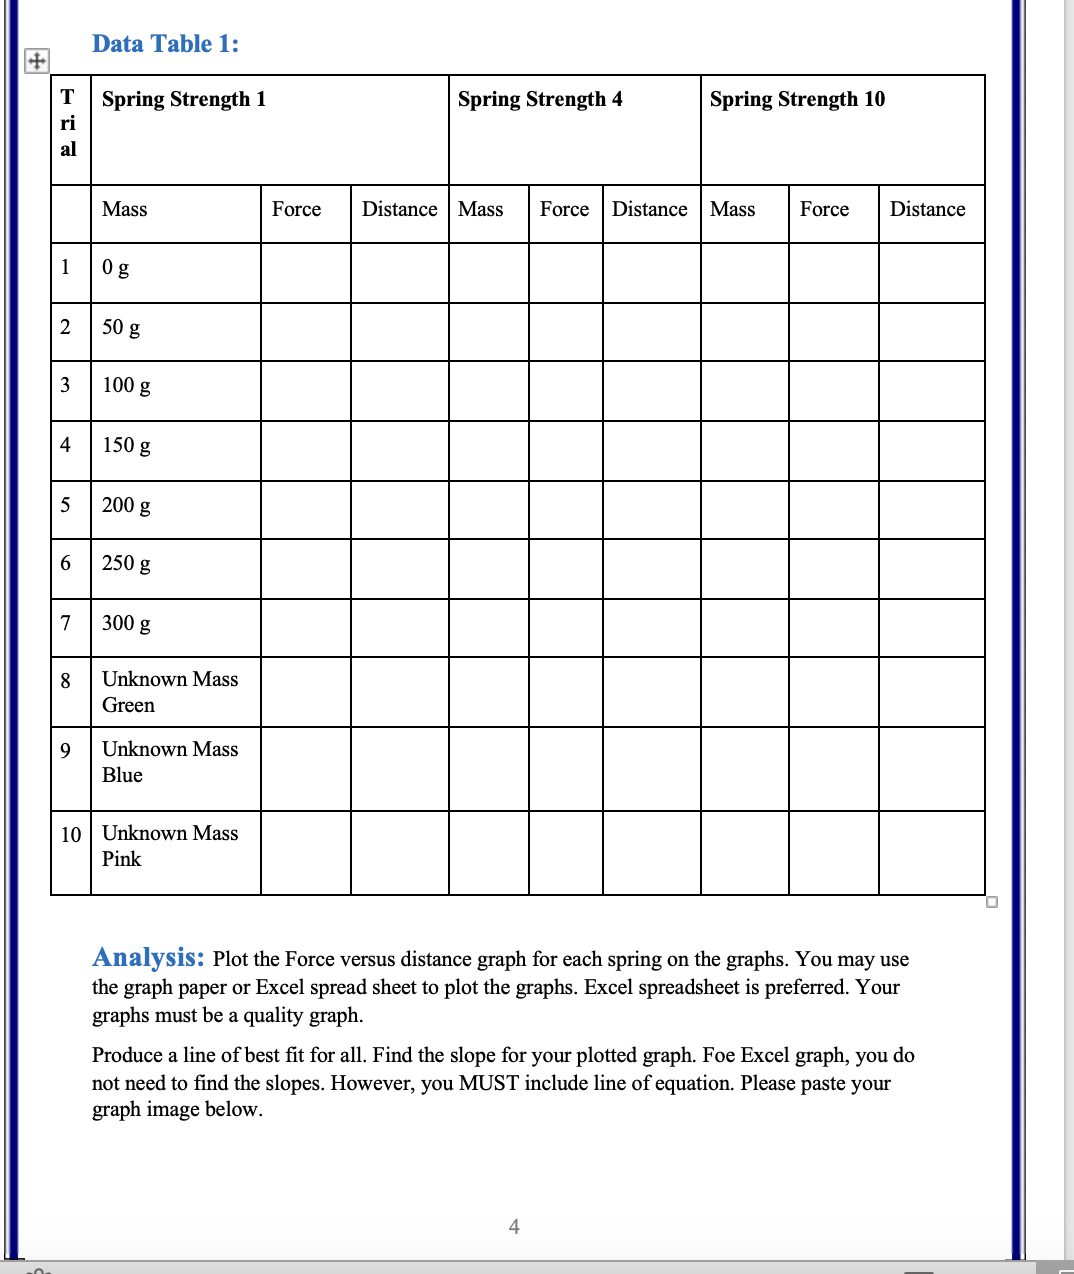
Data Table 1: T Spring Strength 1 Spring Strength 4 Spring Strength 10 Analysis: Plot the Force versus distance graph for each spring on the graphs. You may use the graph paper or Excel spread sheet to plot the graphs. Excel spreadsheet is preferred. Your graphs must be a quality graph. Produce a line of best t for all. Find the slope for your plotted graph. Foe Excel graph, you do not need to nd the slopes. However, you MUST include line of equation. Please paste your graph image below
Step by Step Solution
There are 3 Steps involved in it
1 Expert Approved Answer
Step: 1 Unlock

Question Has Been Solved by an Expert!
Get step-by-step solutions from verified subject matter experts
Step: 2 Unlock
Step: 3 Unlock