

Question: Data Table 1 Year 4 Year 3Year 2Year Year 2 Year 0 (In thousands) Total revenue Net income S 1,836 S 1,796 S1,602 S 1,455
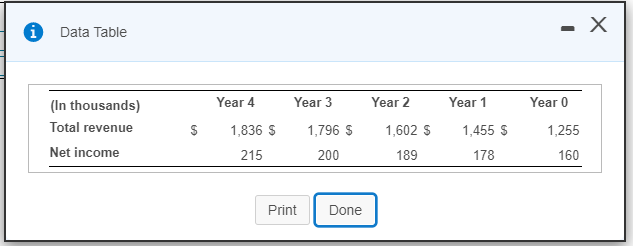
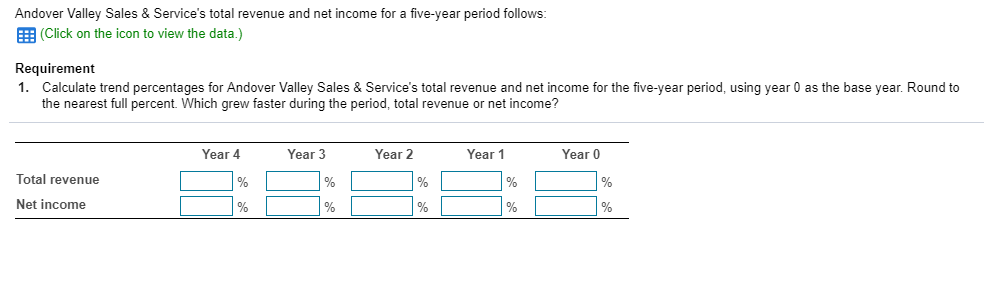
Data Table 1 Year 4 Year 3Year 2Year Year 2 Year 0 (In thousands) Total revenue Net income S 1,836 S 1,796 S1,602 S 1,455 $ 1,255 215 200 189 178 160 Print Done Andover Valley Sales &Service's total revenue and net income for a five-year period follows (Click on the icon to view the data.) Requirement 1. Calculate trend percentages for Andover Valley Sales &Service's total revenue and net income for the five-year period, using year 0 as the base year. Round to the nearest full percent. Which grew faster during the period, total revenue or net income? Year 4 Year 3 Year 2 Year1 Year 0 Total revenue Net income
Step by Step Solution
There are 3 Steps involved in it
1 Expert Approved Answer
Step: 1 Unlock

Question Has Been Solved by an Expert!
Get step-by-step solutions from verified subject matter experts
Step: 2 Unlock
Step: 3 Unlock