

Question: Data table 15 1.341 1.753 2.131 2.602 2.947 15 16 1.337 1.746 2.120 2.583 2.921 16 17 1.333 1.740 2.110 2.567 2.898 17 18
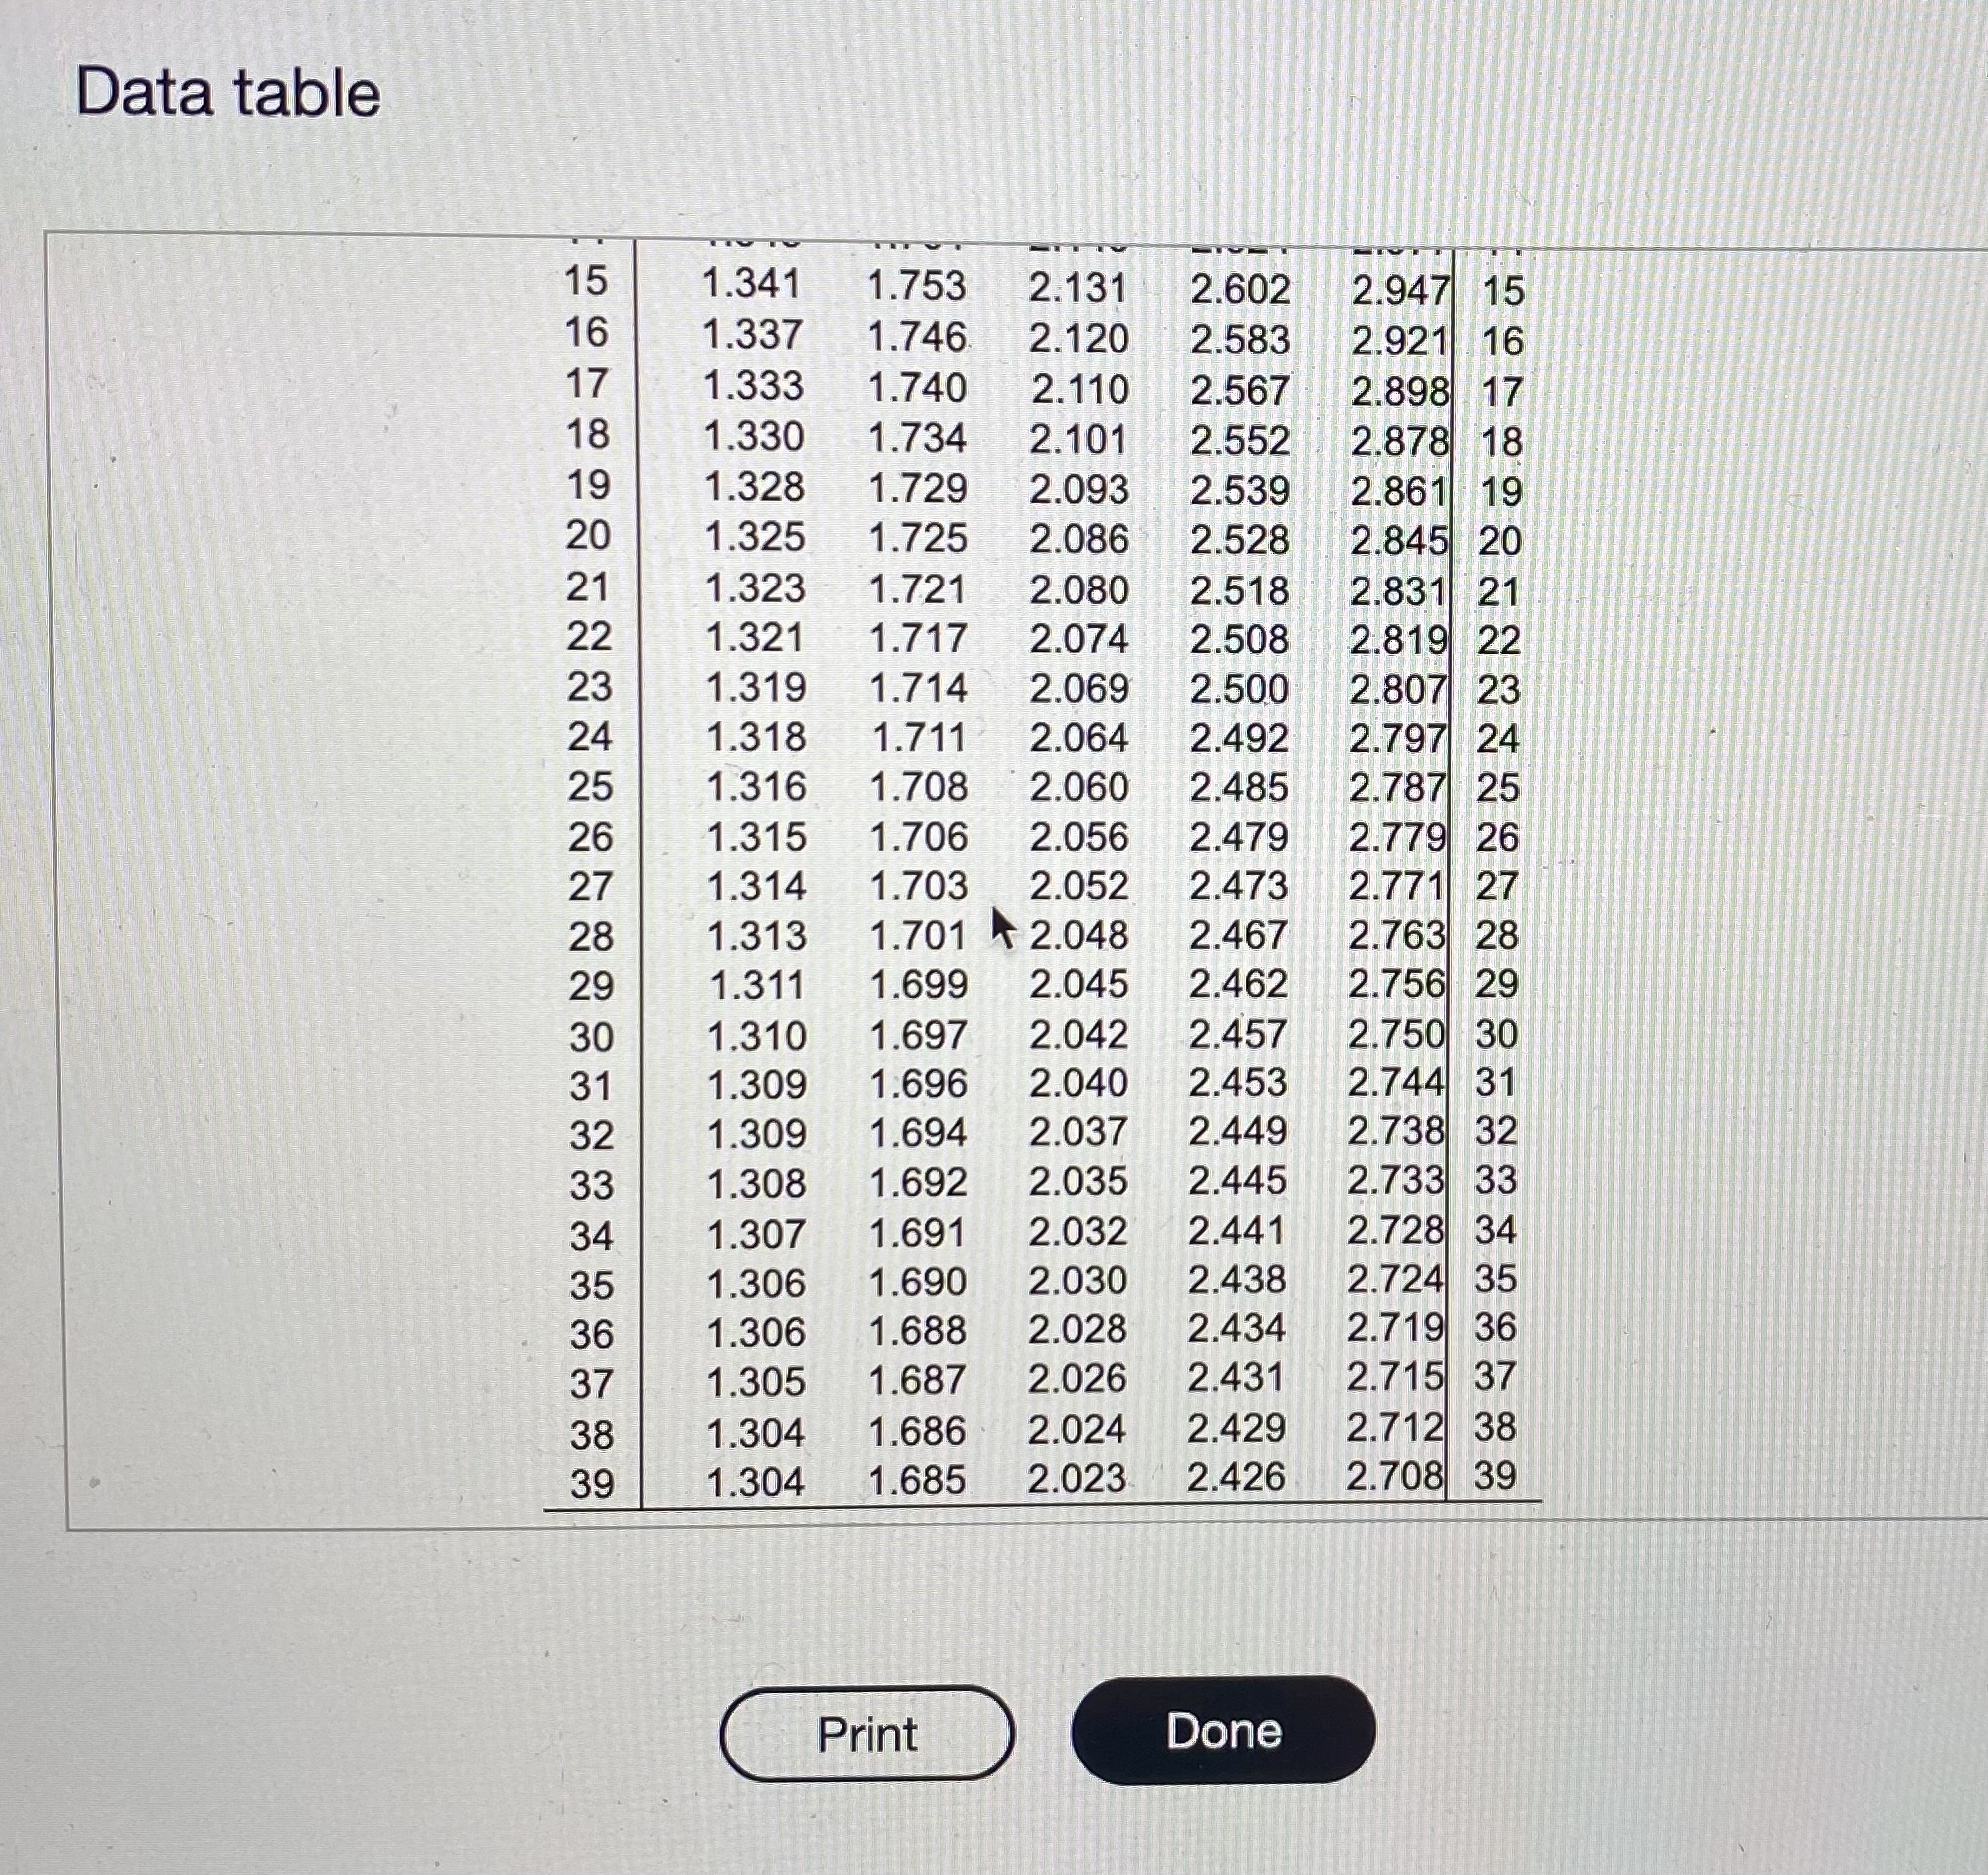
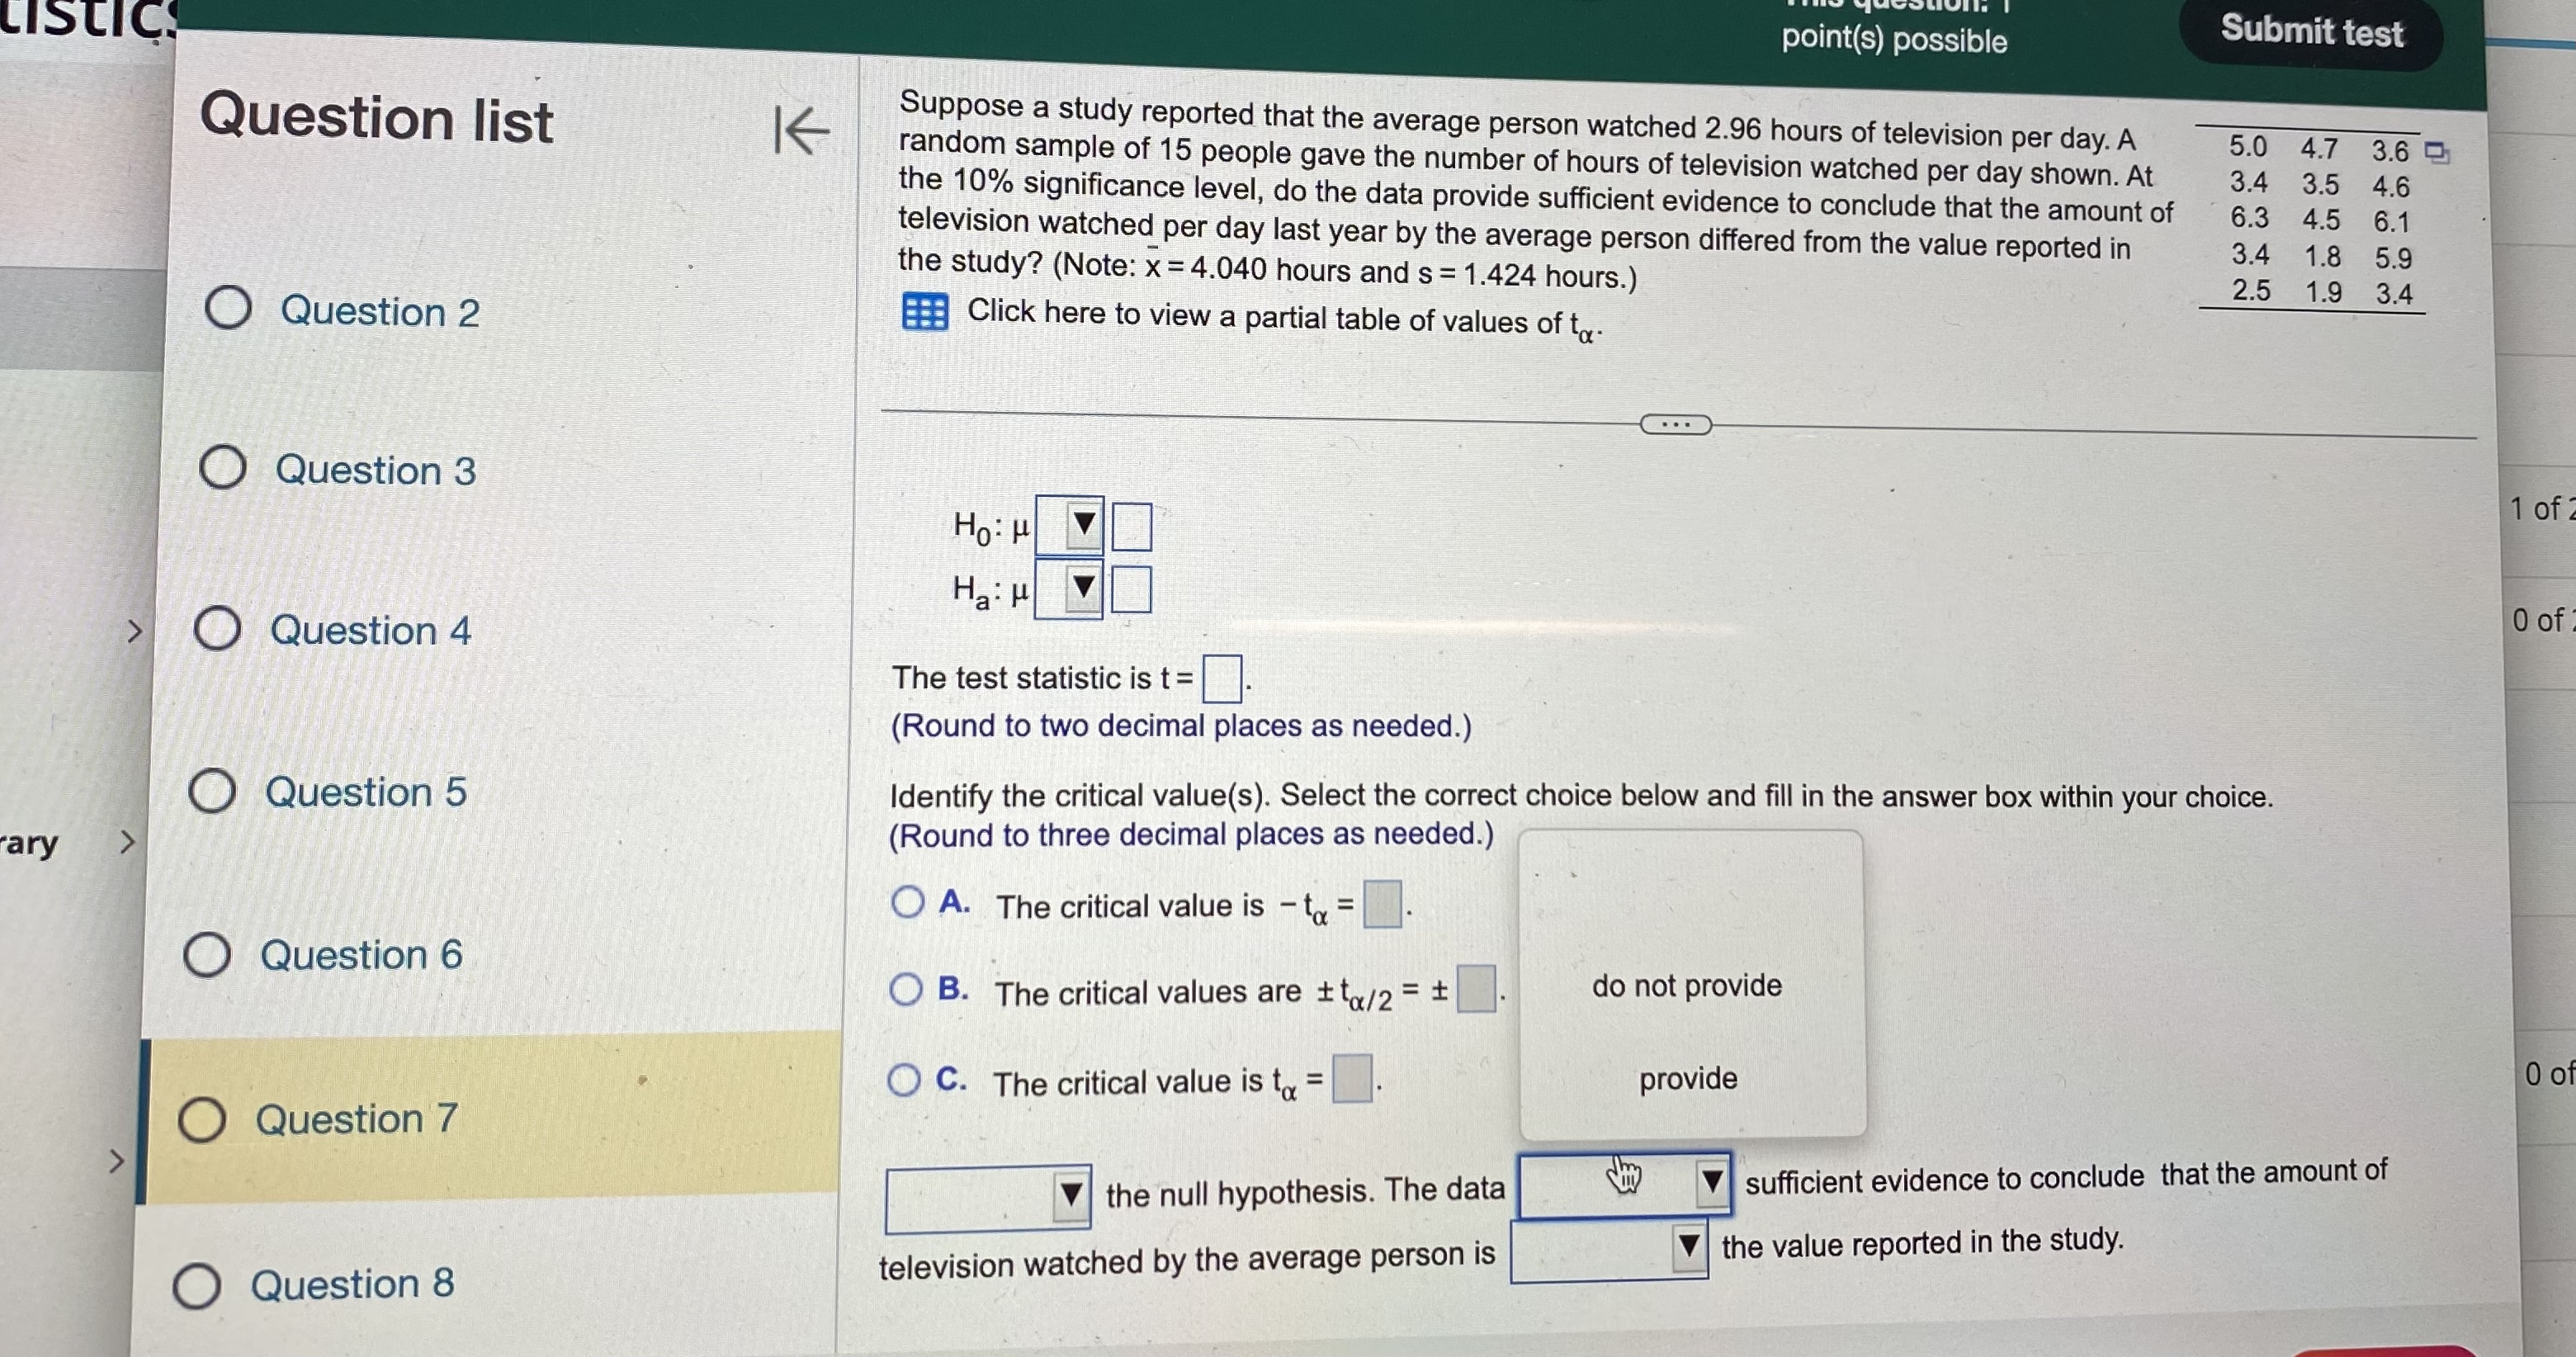
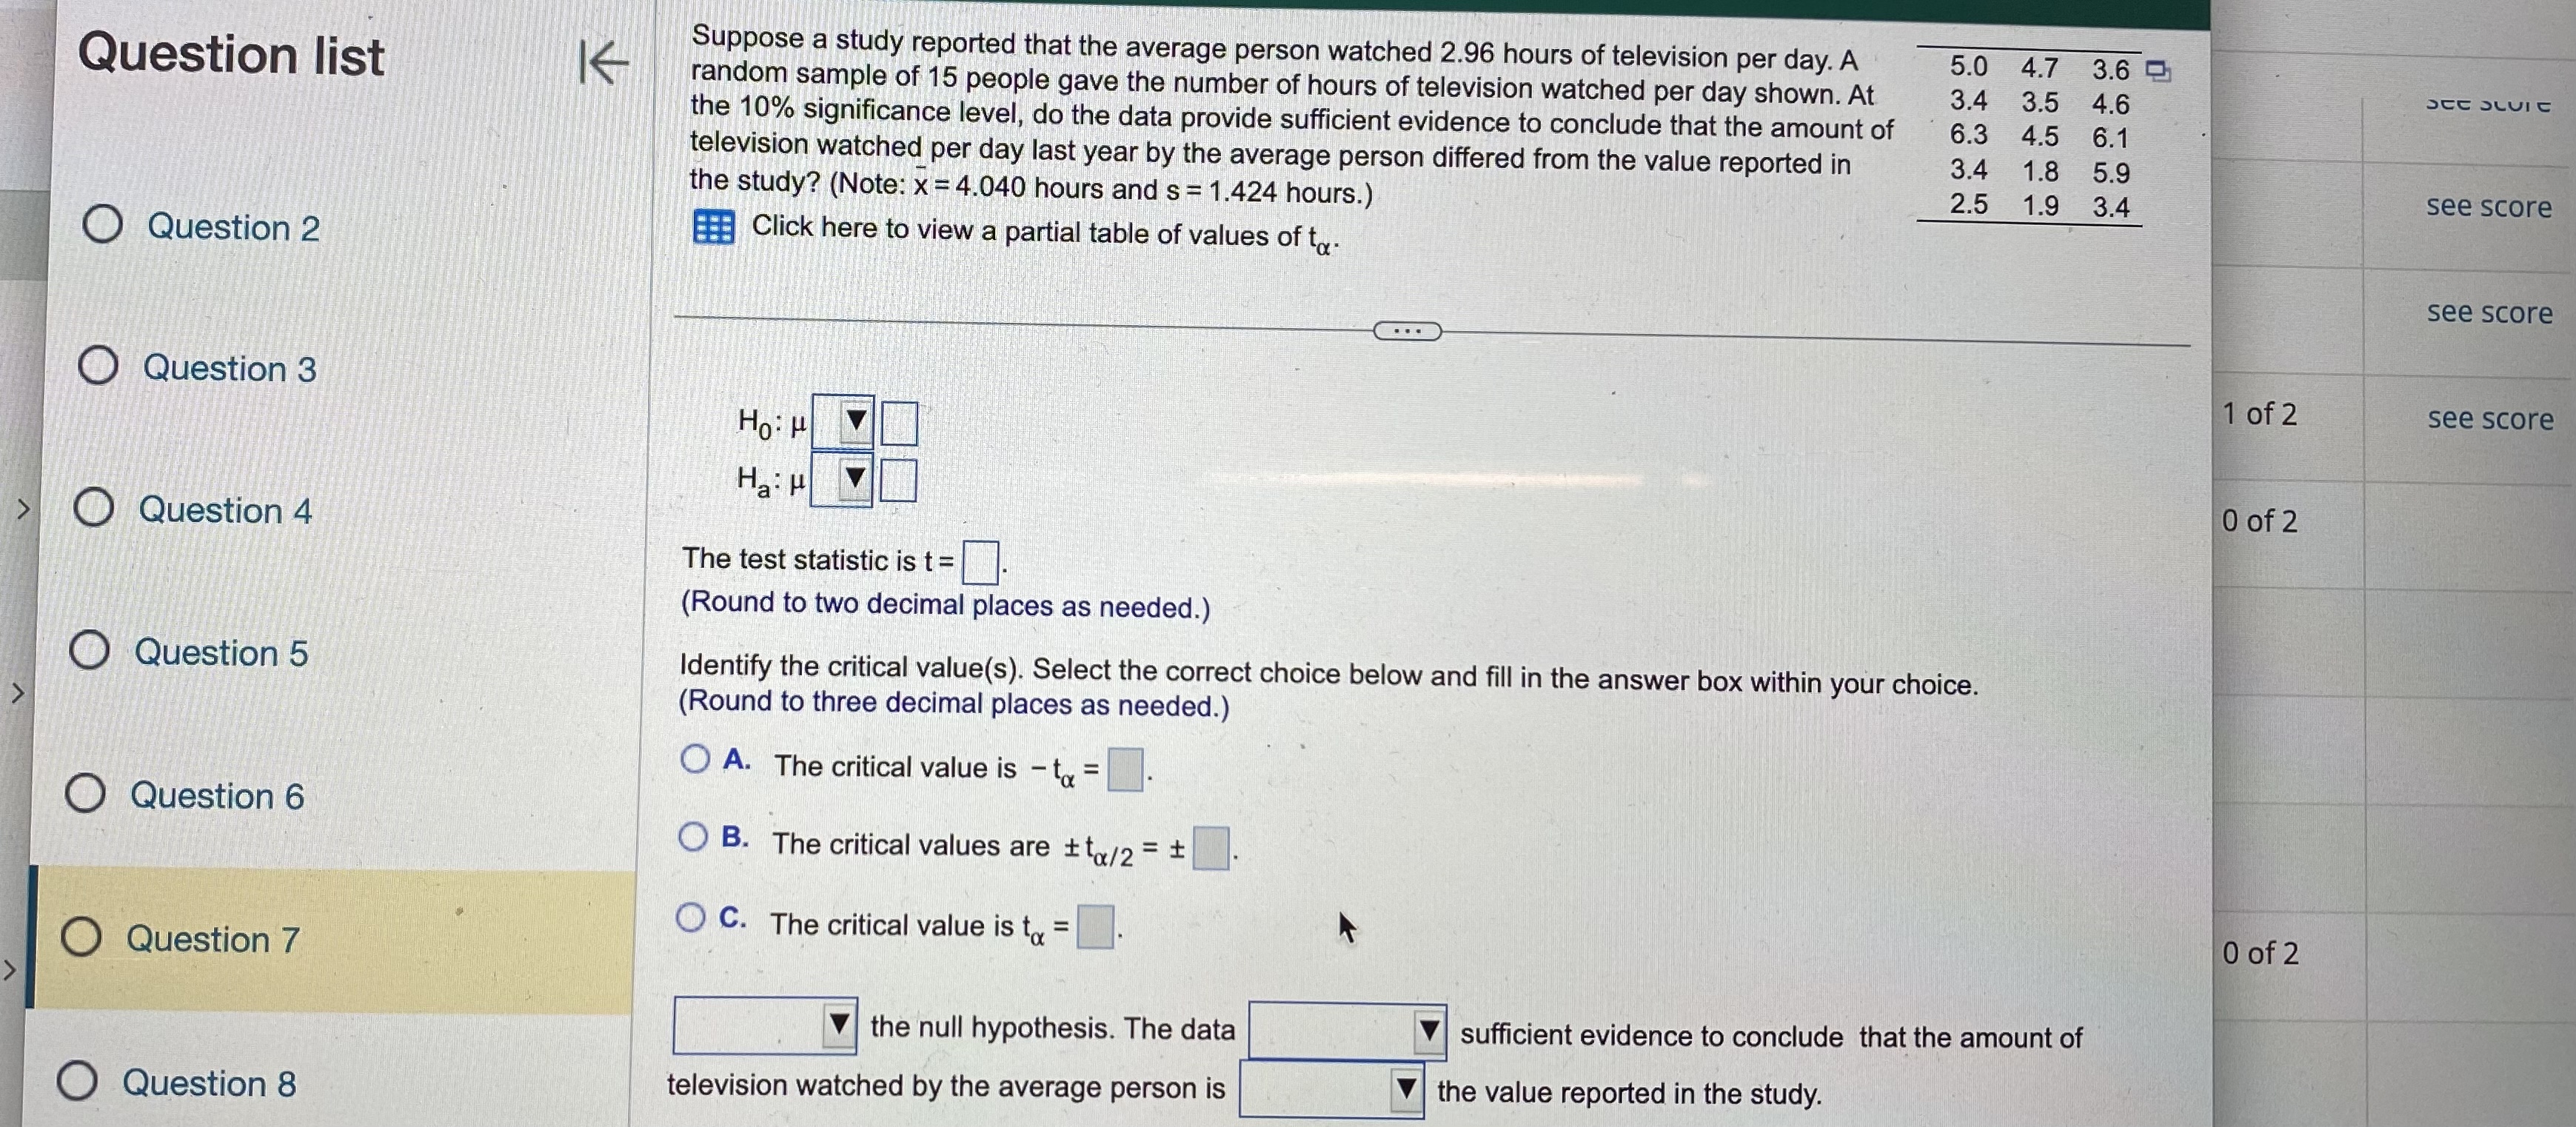
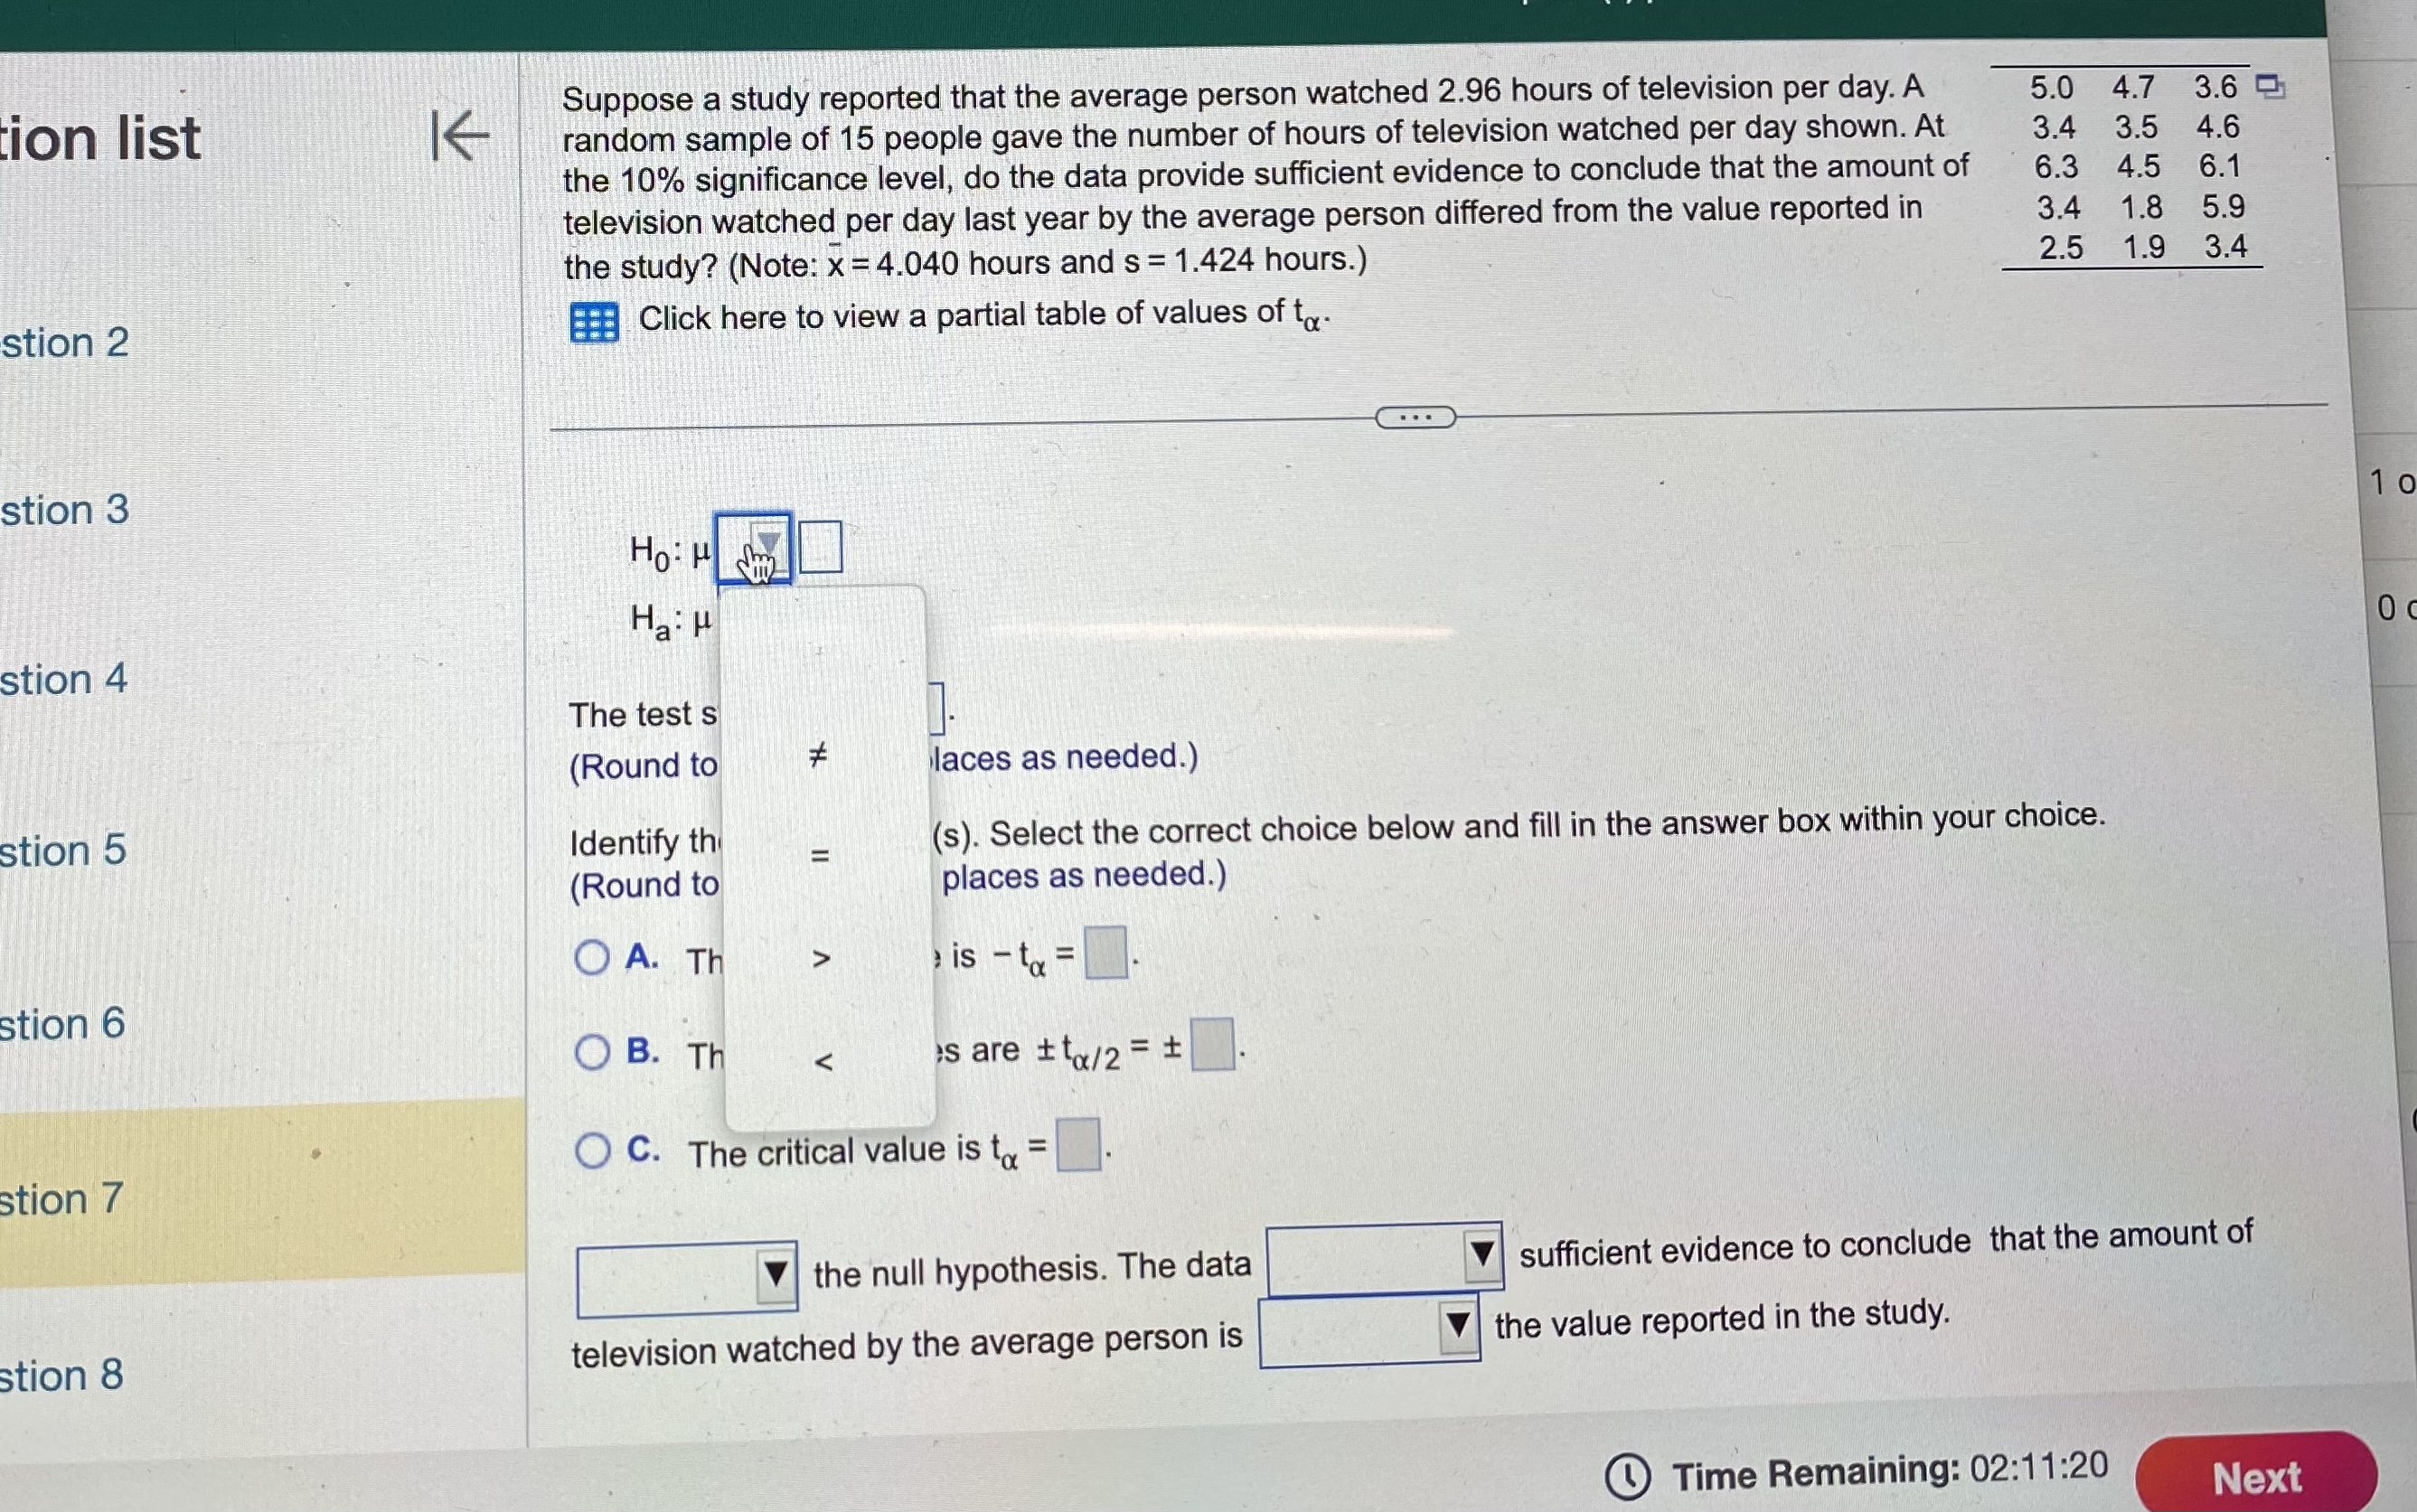
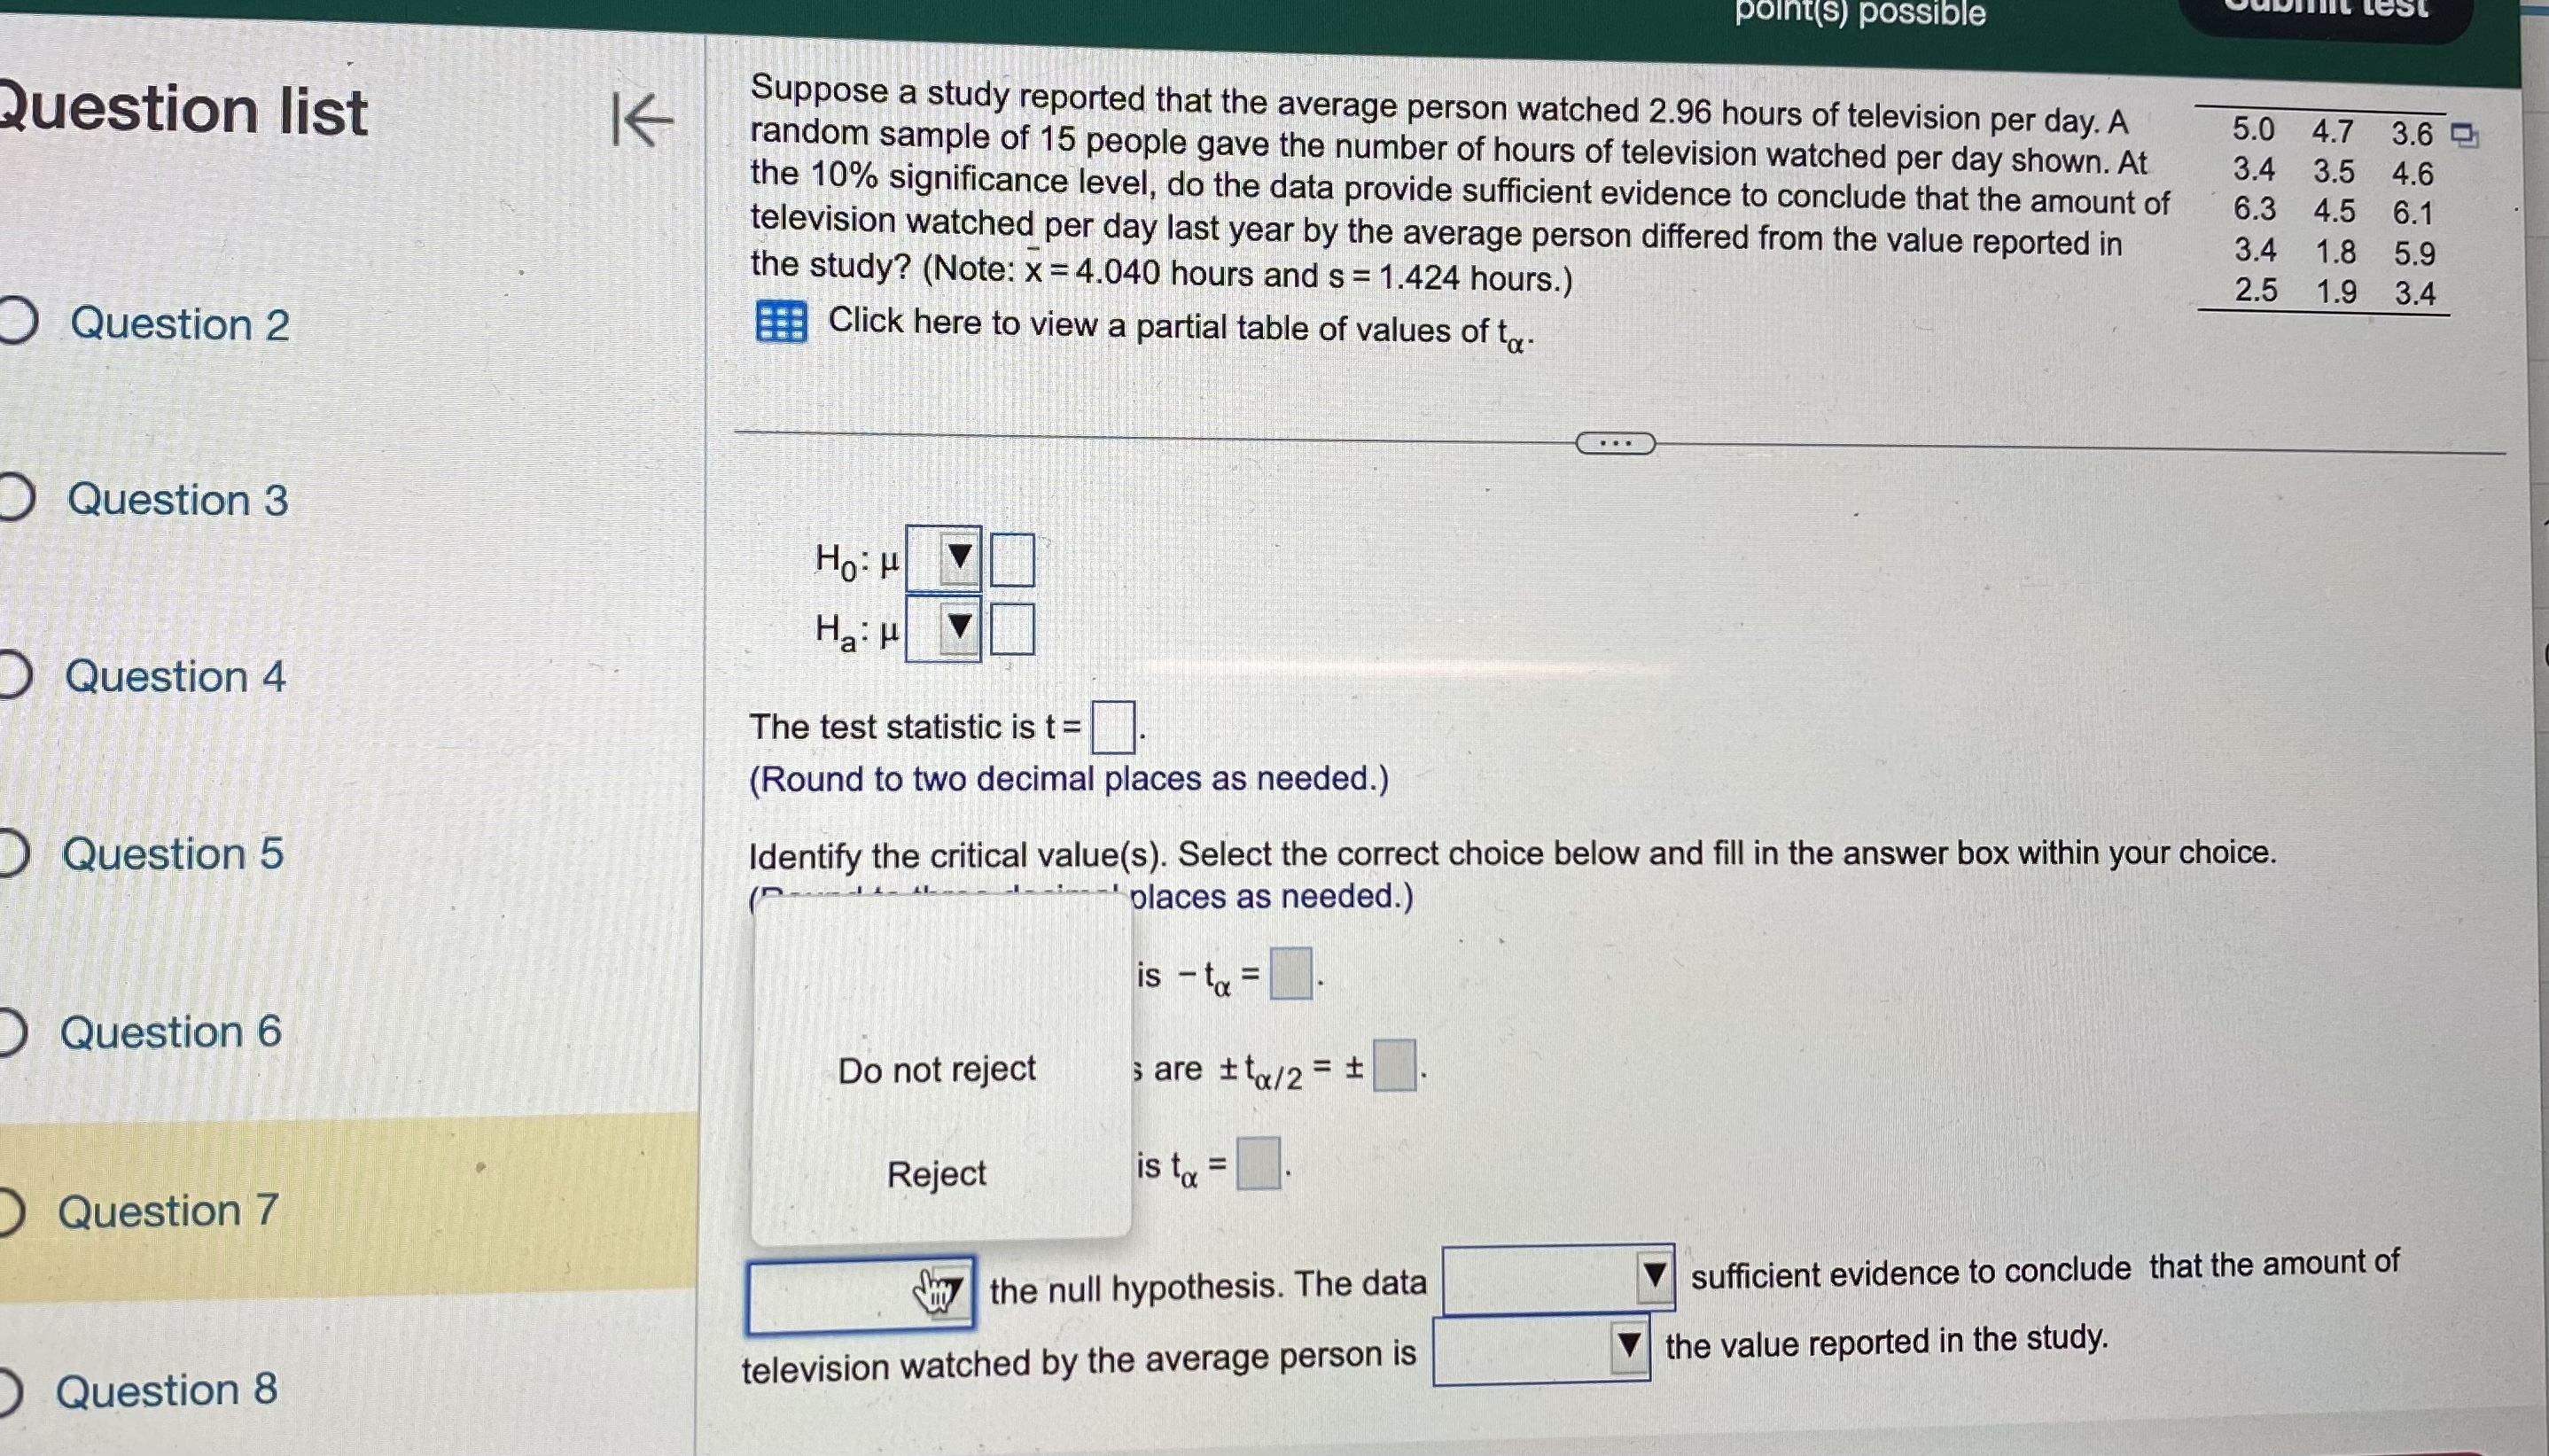
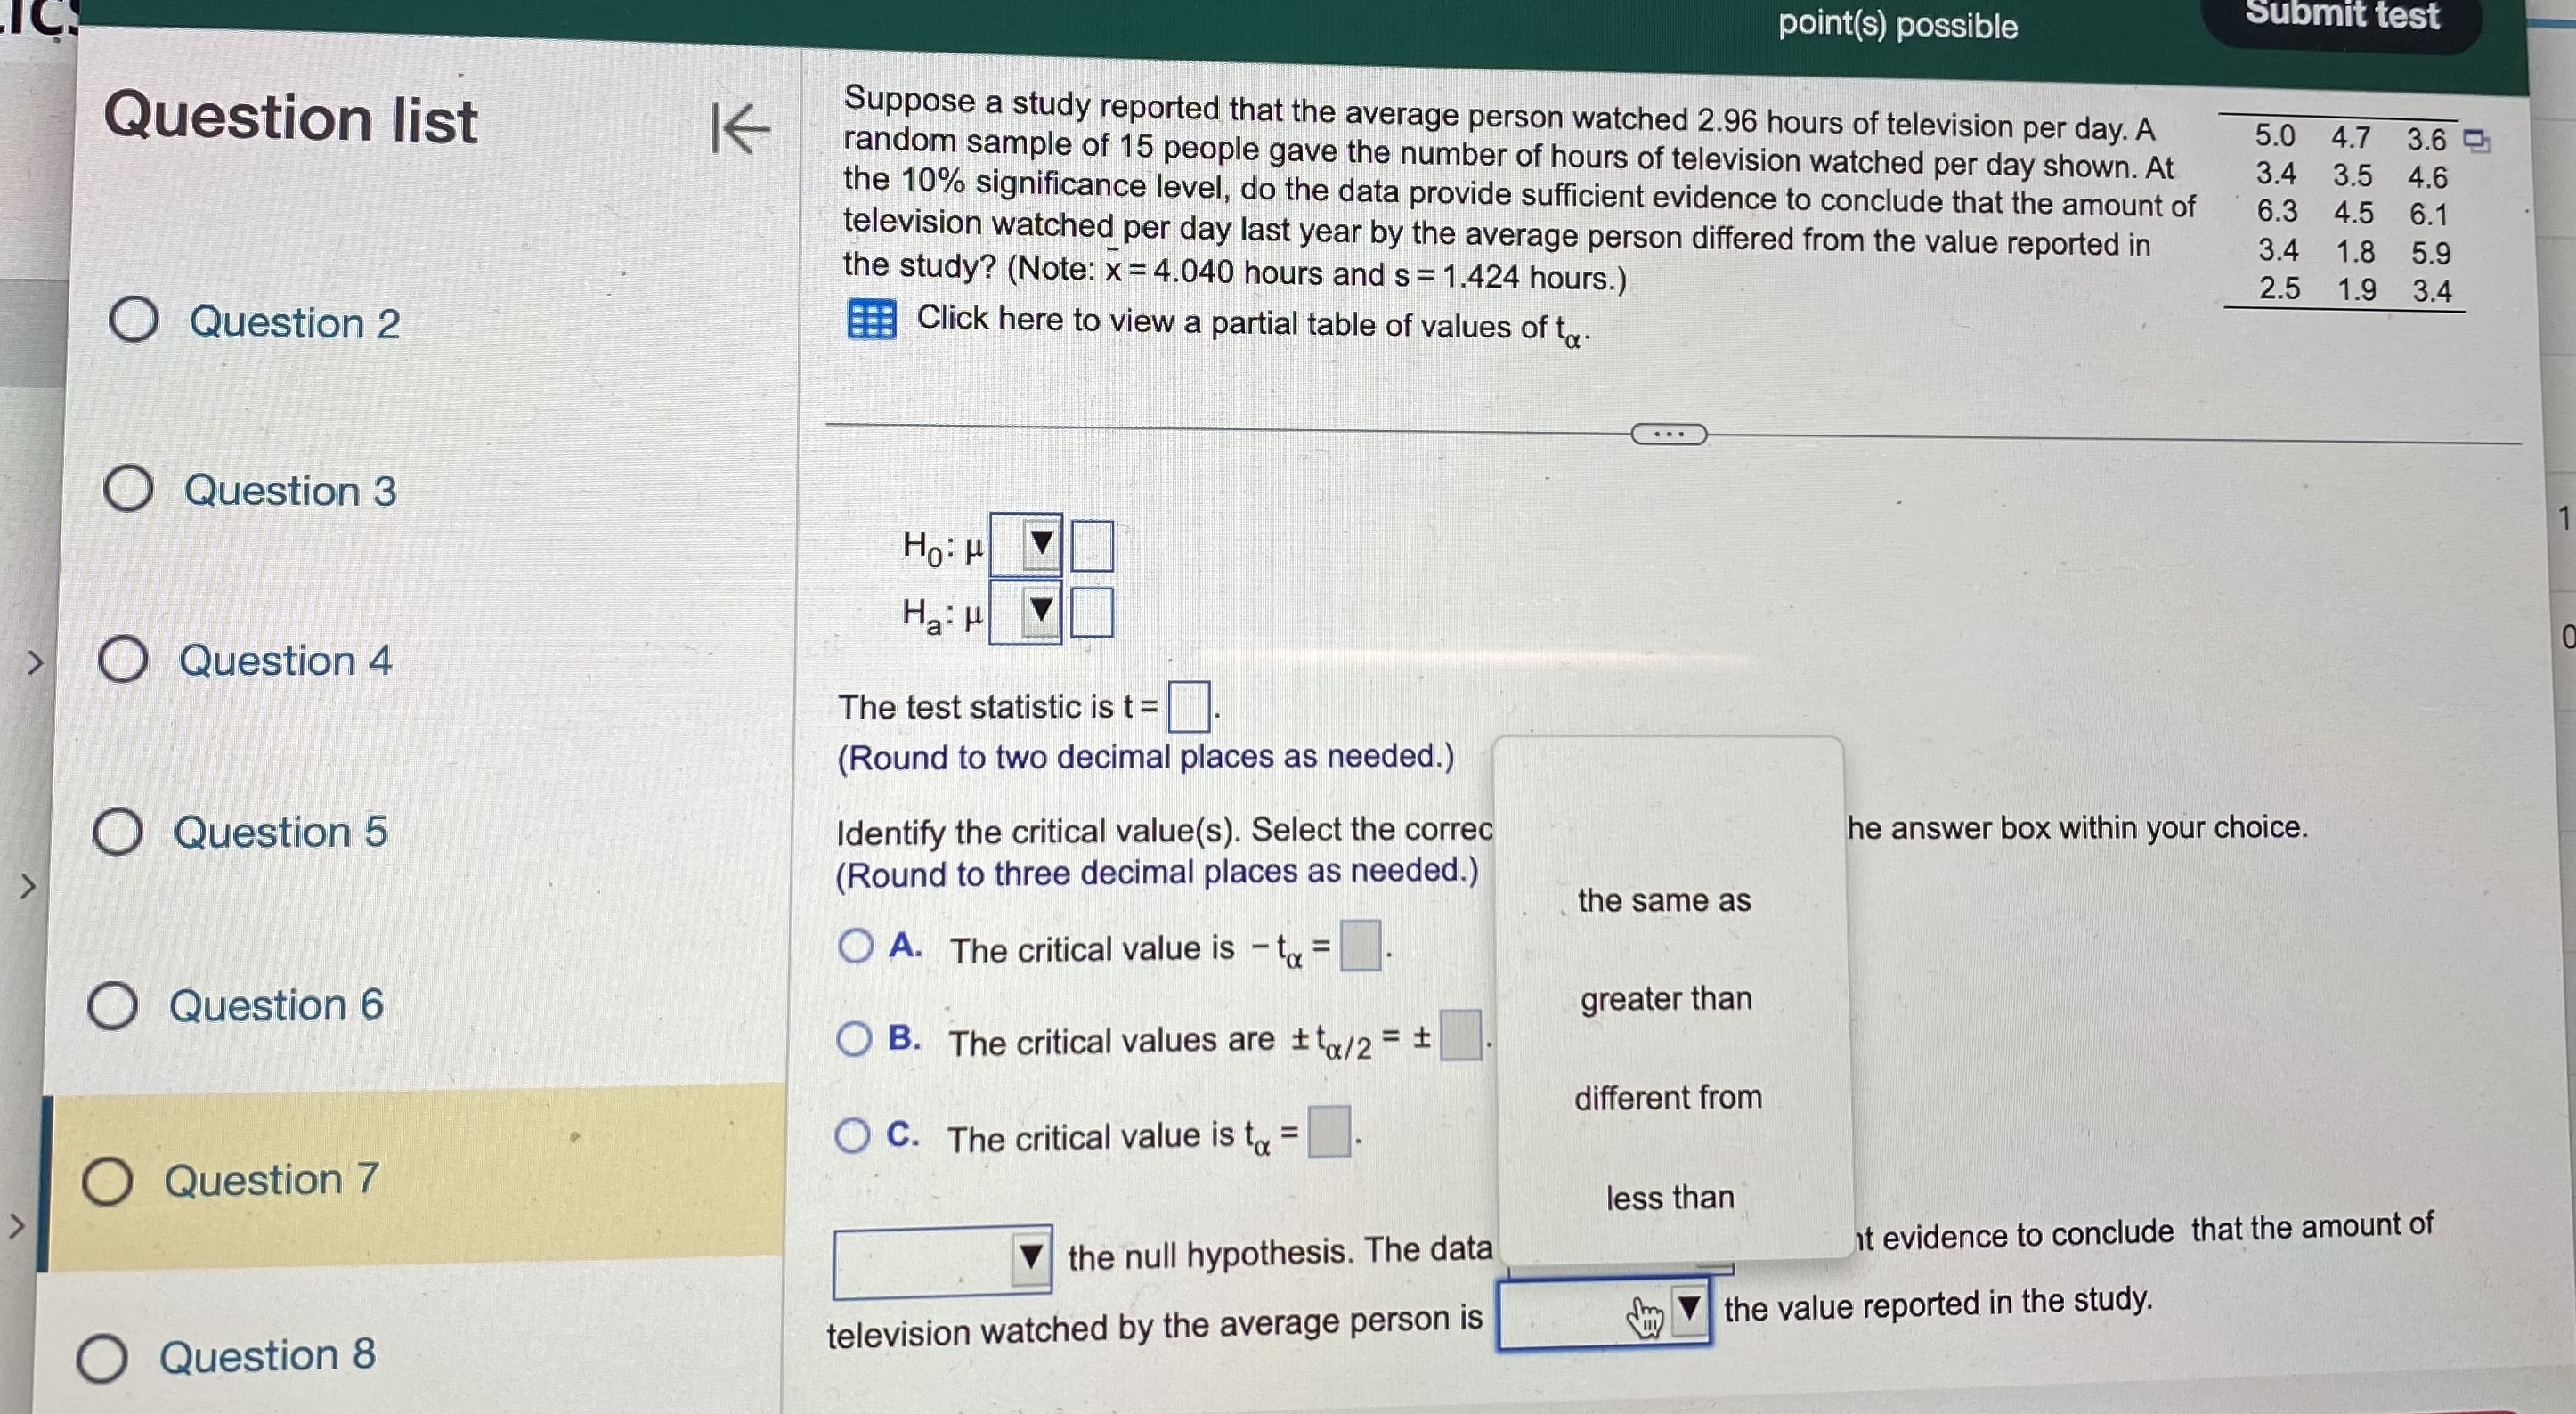
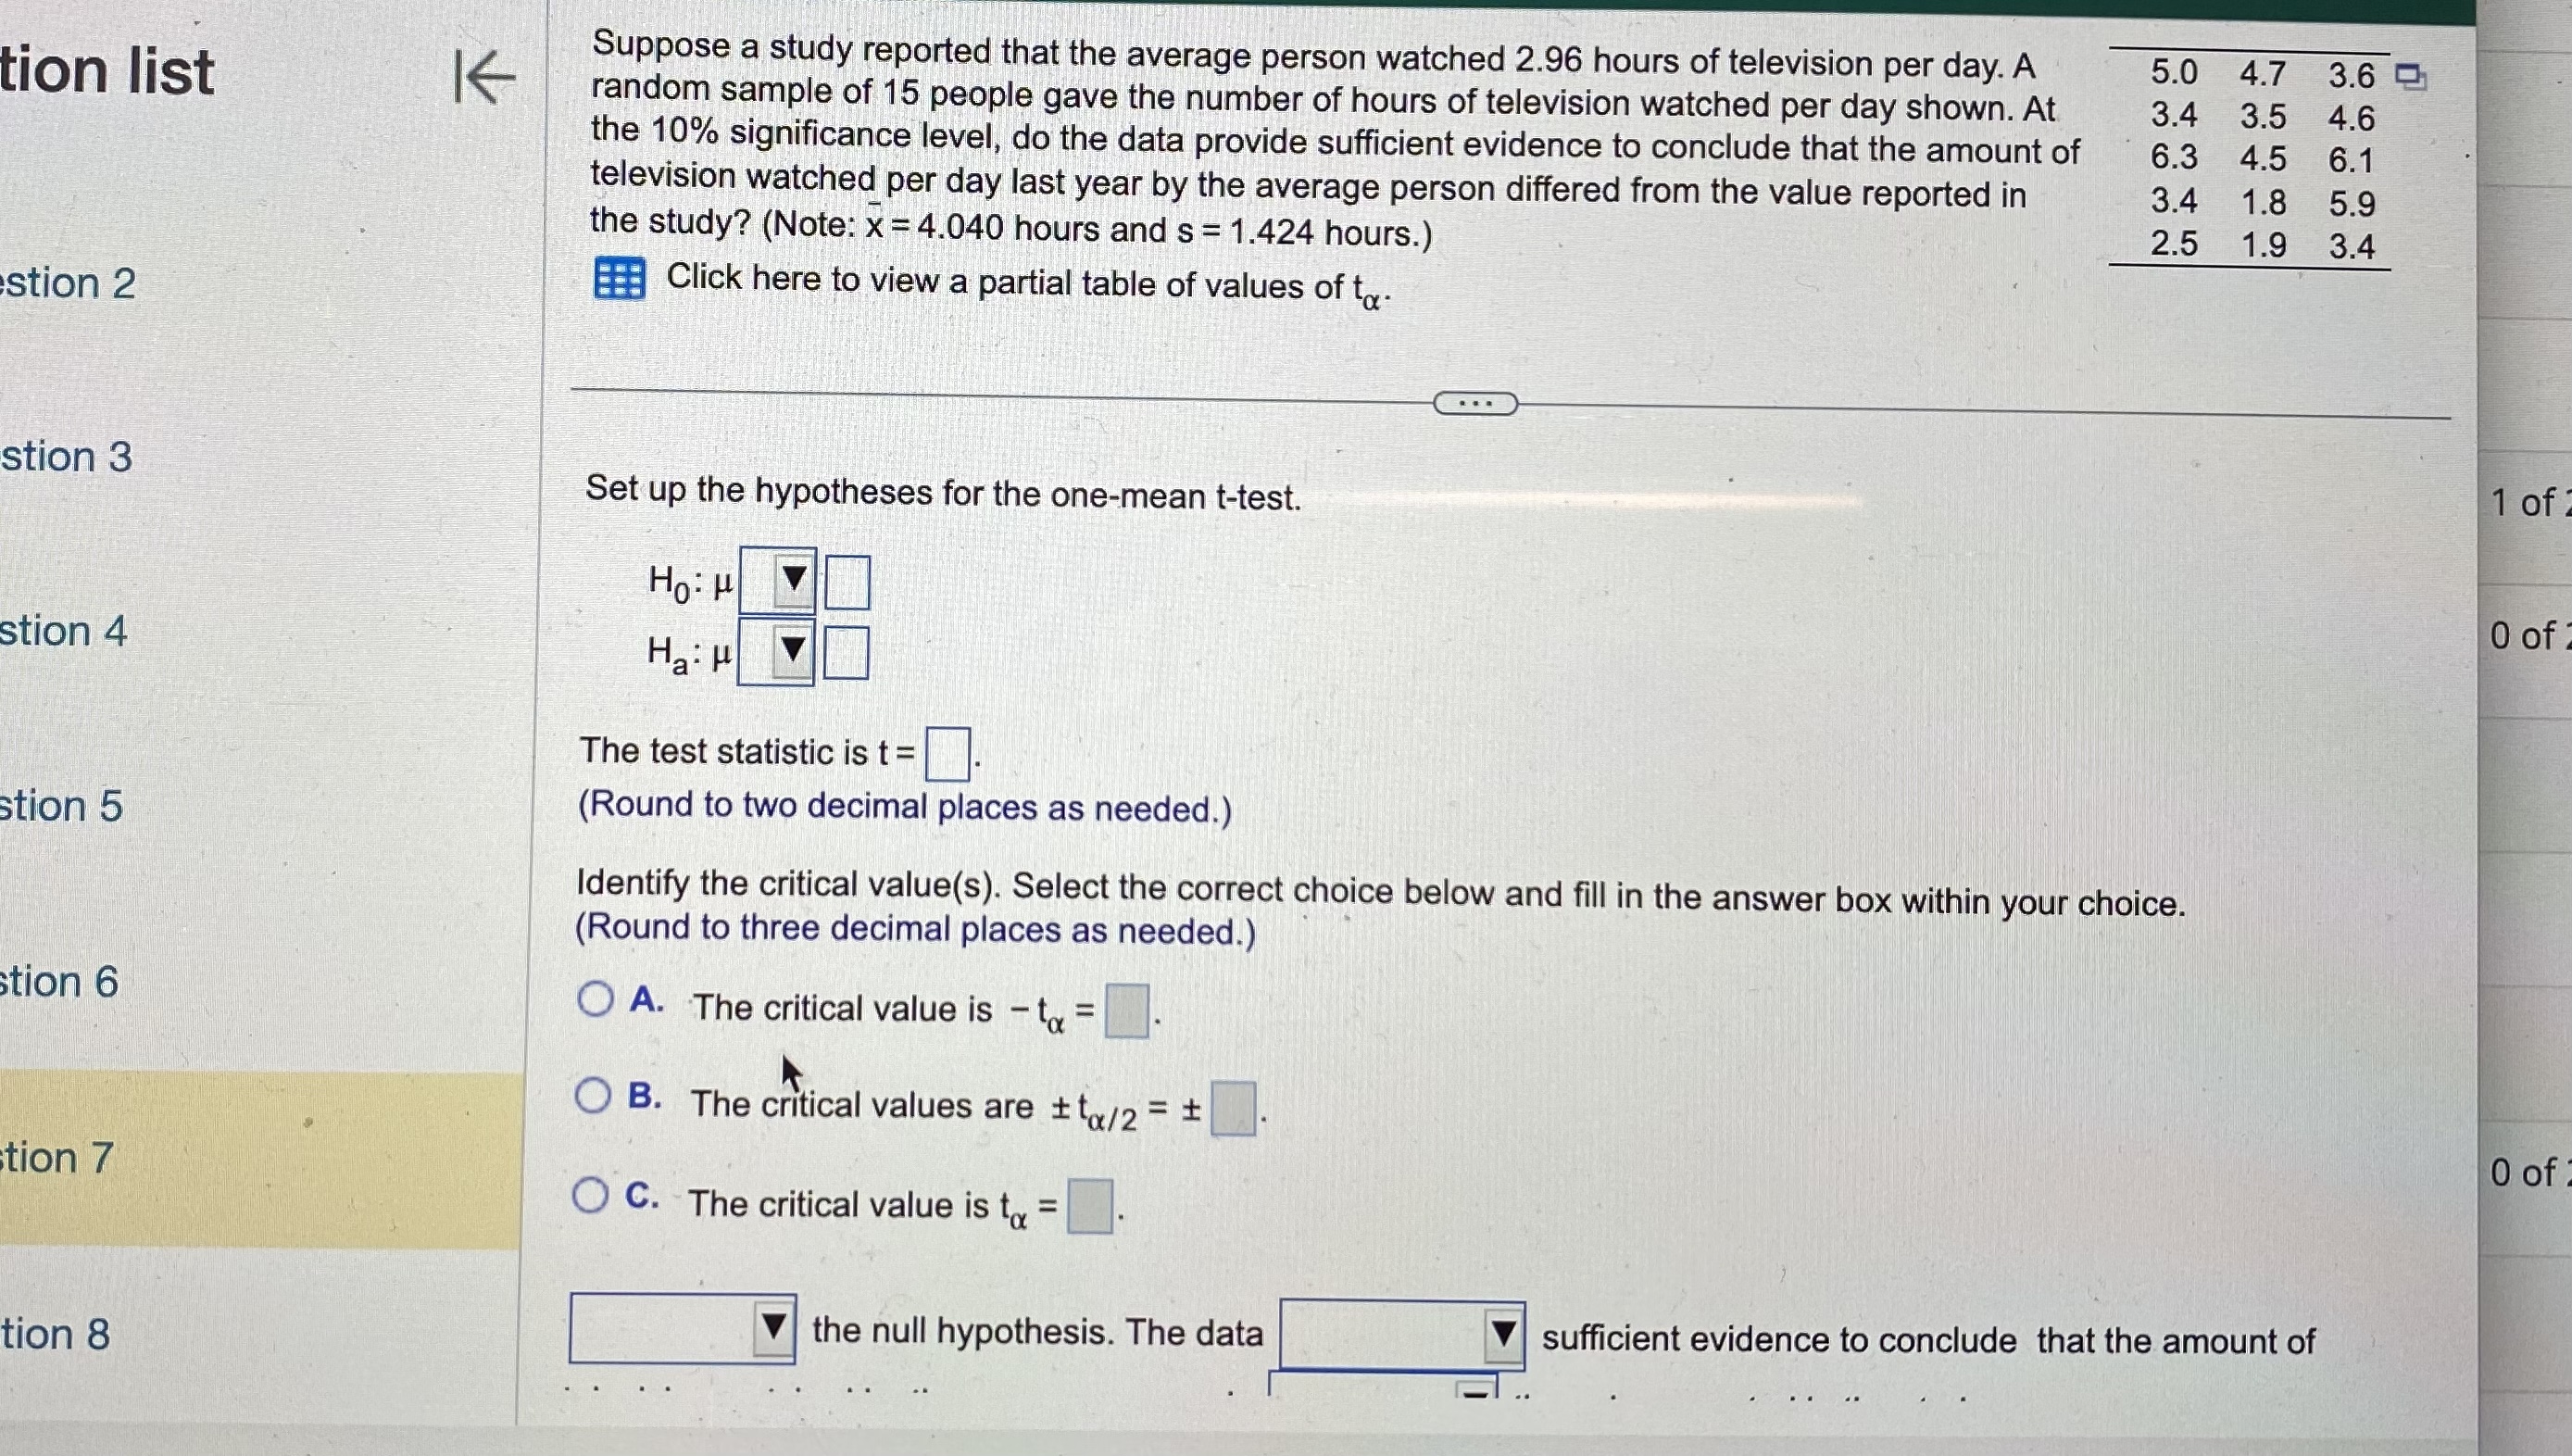
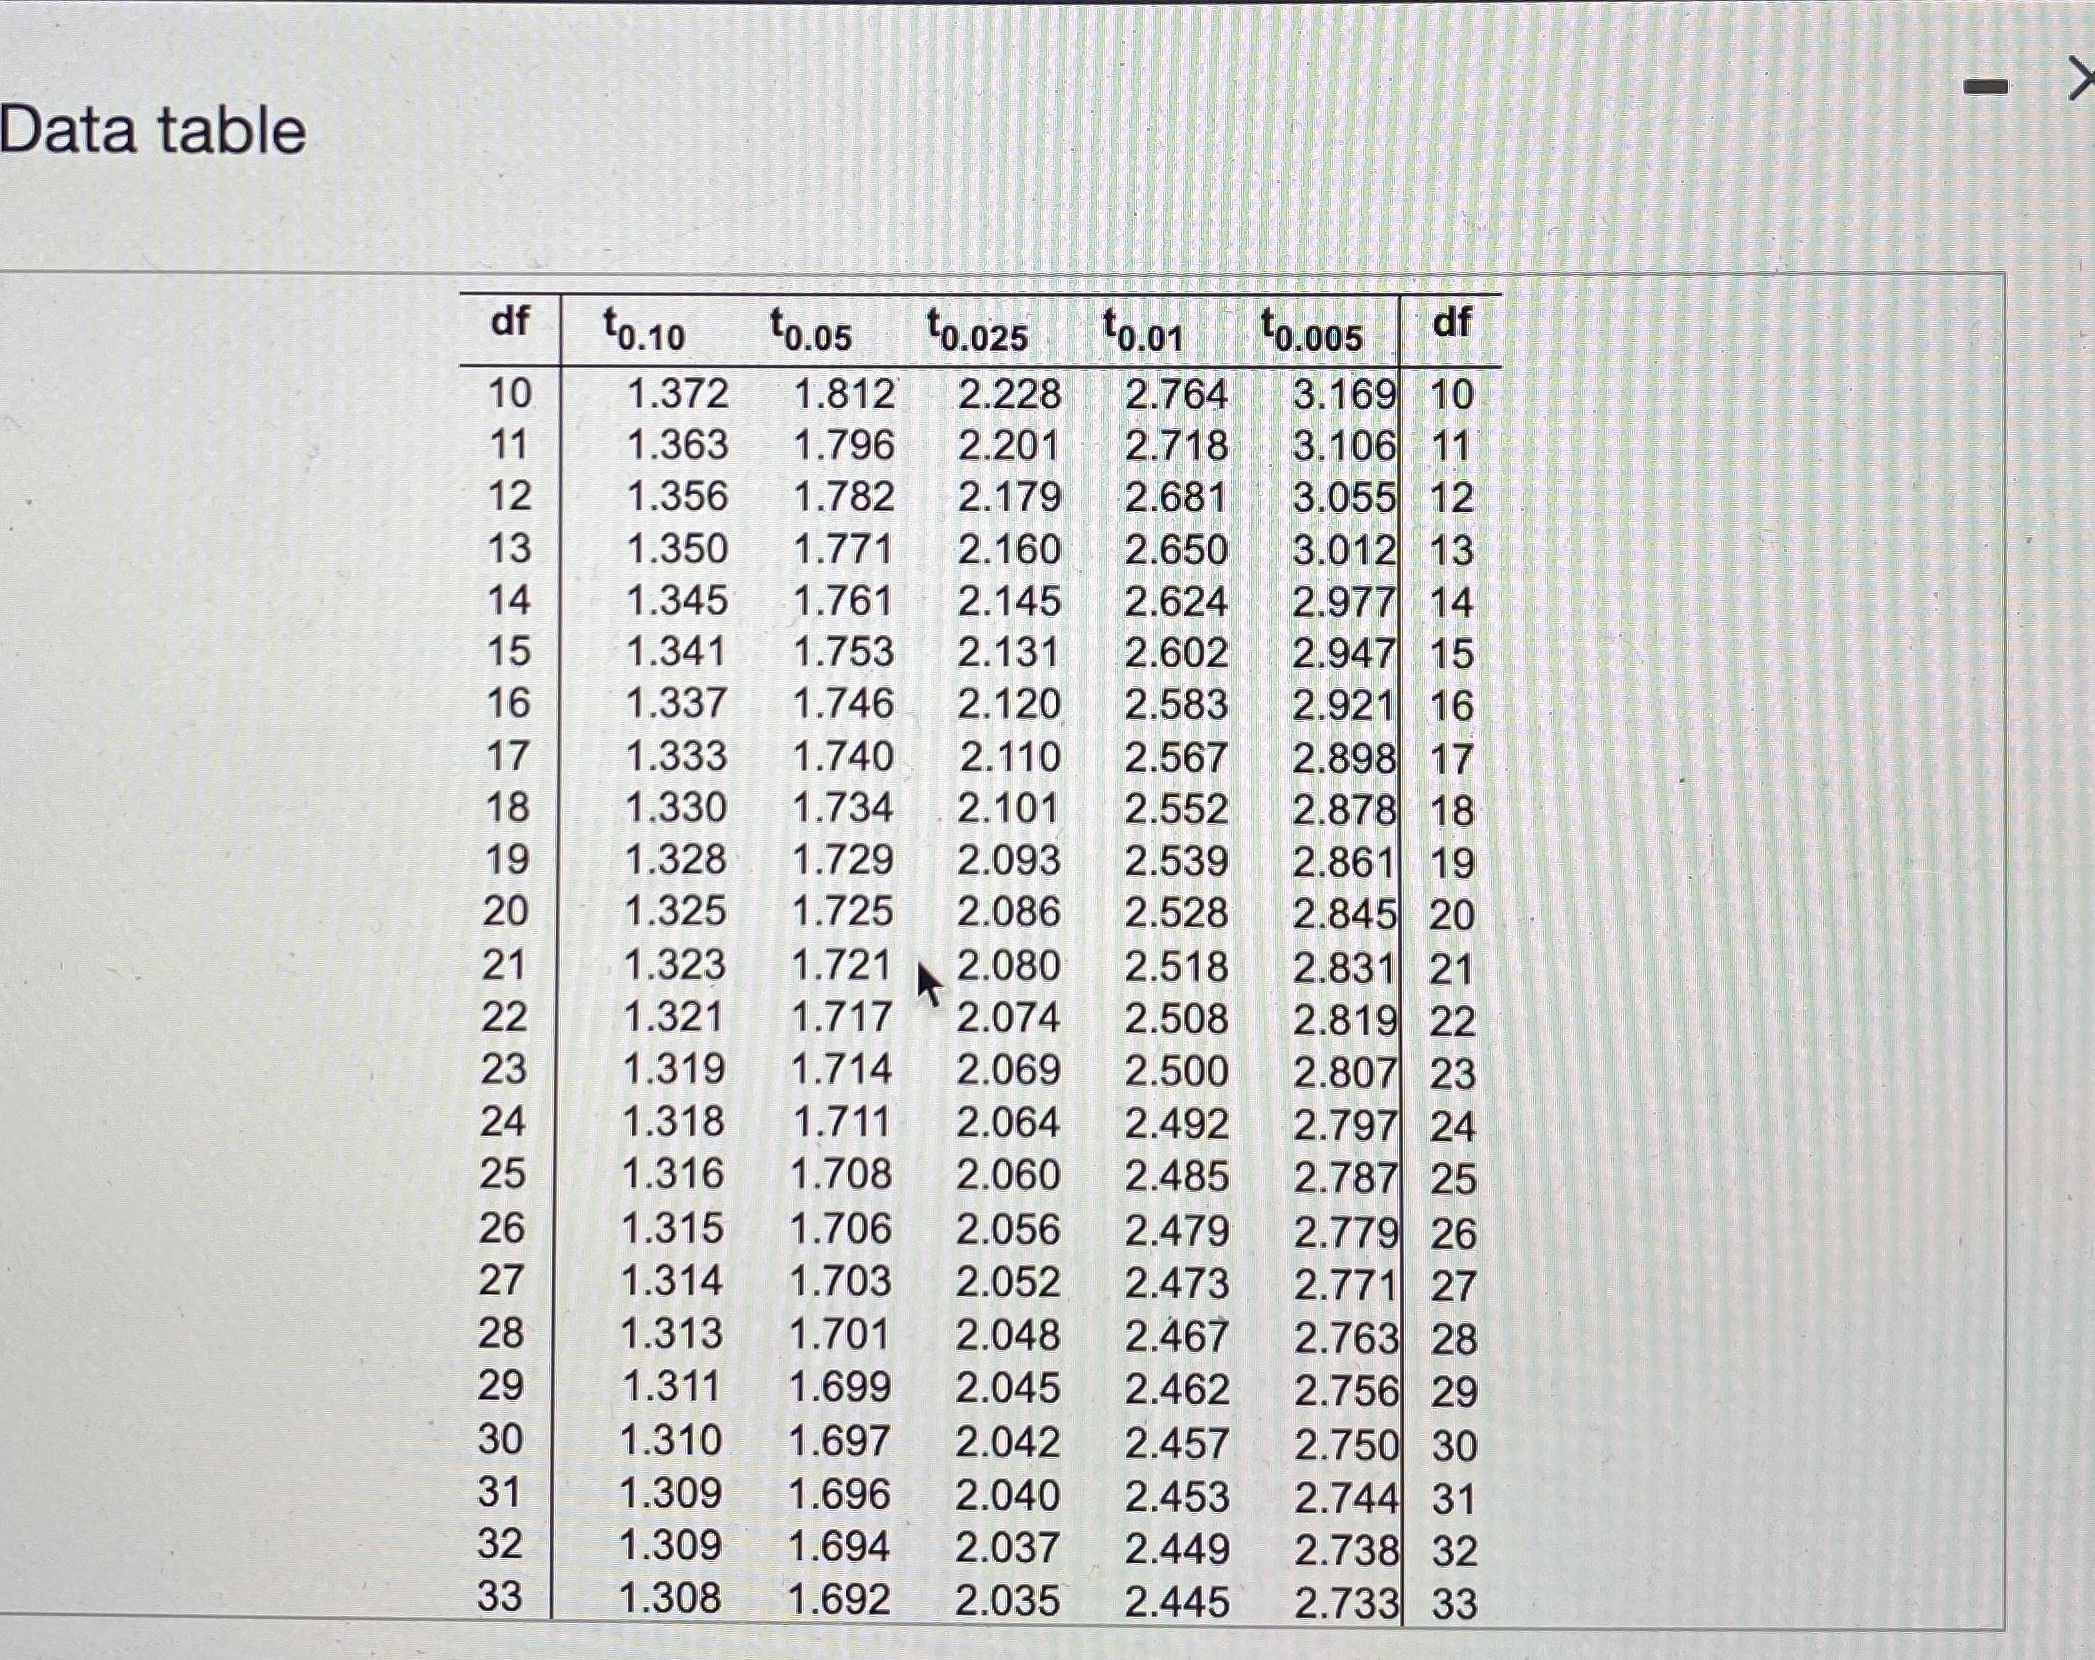
Data table 15 1.341 1.753 2.131 2.602 2.947 15 16 1.337 1.746 2.120 2.583 2.921 16 17 1.333 1.740 2.110 2.567 2.898 17 18 1.330 1.734 2.101 2.552 2.878 18 19 1.328 1.729 2.093 2.539 2.861 19 20 1.325 1.725 2.086 2.528 2.845 20 21 1.323 1.721 2.080 2.518 2.831 21 22 1.321 1.717 2.074 2.508 2.819 22 23 1.319 1.714 2.069 2.500 2.807 23 24 1.318 1.711 2.064 2.492 2.797 24 25 1.316 1.708 2.060 2.485 2.787 25 26 1.315 1.706 2.056 2.479 2.779 26 27 1.314 1.703 2.052 2.473 2.771 27 28 1.313 1.701 2.048 2.467 2.763 28 29 1.311 1.699 2.045 2.462 2.756 29 30 1.310 1.697 2.042 2.457 2.750 30 31 1.309 1.696 2.040 2.453 2.744 31 32 1.309 1.694 2.037 2.449 2.738 32 33 1.308 1.692 2.035 2.445 2.733 33 34 1.307 1.691 2.032 2.441 2.728 34 35 1.306 1.690 2.030 2.438 2.724 35 36 1.306 1.688 2.028 2.434 2.719 36 37 1.305 1.687 2.026 2.431 2.715 37 38 1.304 1.686 2.024 2.429 2.712 38 39 1.304 1.685 2.023 2.426 2.708 39 Print Done stic Question list rary O Question 2 K point(s) possible Suppose a study reported that the average person watched 2.96 hours of television per day. A random sample of 15 people gave the number of hours of television watched per day shown. At the 10% significance level, do the data provide sufficient evidence to conclude that the amount of television watched per day last year by the average person differed from the value reported in the study? (Note: x = 4.040 hours and s = 1.424 hours.) Click here to view a partial table of values of to- Submit test 5.0 4.7 3.6 3.4 3.5 4.6 6.3 4.5 6.1 3.4 1.8 5.9 2.5 1.9 3.4 O Question 3 > Question 4 > Question 5 O Ho: H Ha H The test statistic is t = (Round to two decimal places as needed.) Identify the critical value(s). Select the correct choice below and fill in the answer box within your choice. (Round to three decimal places as needed.) 1 of 2 0 of: OA. The critical value is - t = Question 6 OB. The critical values are ta/2 = OC. The critical value is t = do not provide provide 0 of O Question 7 O Question 8 the null hypothesis. The data television watched by the average person is sufficient evidence to conclude that the amount of the value reported in the study. Question list K O Question 2 Question 3 > O Question 4 O Question 5 O Question 6 Suppose a study reported that the average person watched 2.96 hours of television per day. A random sample of 15 people gave the number of hours of television watched per day shown. At the 10% significance level, do the data provide sufficient evidence to conclude that the amount of television watched per day last year by the average person differed from the value reported in the study? (Note: x = 4.040 hours and s = 1.424 hours.) Click here to view a partial table of values of ta 5.0 4.7 3.6 3.4 3.5 4.6 6.3 4.5 6.1 3.4 1.8 5.9 c 2.5 1.9 3.4 see score Hot Ha H The test statistic is t = (Round to two decimal places as needed.) Identify the critical value(s). Select the correct choice below and fill in the answer box within your choice. (Round to three decimal places as needed.) OA. The critical value is - t = OB. The critical values are ta/2 = see score 1 of 2 see score 0 of 2 OC. The critical value is to Question 7 = 0 of 2 the null hypothesis. The data sufficient evidence to conclude that the amount of Question 8 television watched by the average person is the value reported in the study. tion list stion 2 stion 3 stion 4 Suppose a study reported that the average person watched 2.96 hours of television per day. A random sample of 15 people gave the number of hours of television watched per day shown. At the 10% significance level, do the data provide sufficient evidence to conclude that the amount of television watched per day last year by the average person differed from the value reported in the study? (Note: x = 4.040 hours and s 1.424 hours.) = Click here to view a partial table of values of t 5.0 4.7 3.6 3.4 3.5 4.6 6.3 4.5 6.1 3.4 1.8 5.9 2.5 1.9 3.4 Hot Ha H laces as needed.) (s). Select the correct choice below and fill in the answer box within your choice. places as needed.) is - ta= The test s (Round to stion 5 Identify the II (Round to OA. Th stion 6 OB. Th < es are ta/2 = stion 7 OC. The critical value is t = the null hypothesis. The data sufficient evidence to conclude that the amount of stion 8 television watched by the average person is the value reported in the study. Time Remaining: 02:11:20 Next 1 0 0 Question list K Question 2 Question 3. Question 4 Question 5 point(s) possible Suppose a study reported that the average person watched 2.96 hours of television per day. A random sample of 15 people gave the number of hours of television watched per day shown. At the 10% significance level, do the data provide sufficient evidence to conclude that the amount of television watched per day last year by the average person differed from the value reported in the study? (Note: x = 4.040 hours and s = 1.424 hours.) Click here to view a partial table of values of t- 5.0 4.7 3.6 3.4 3.5 4.6 6.3 4.5 6.1 3.4 1.8 5.9 2.5 1.9 3.4 Ho H Ha H The test statistic is t = (Round to two decimal places as needed.) Identify the critical value(s). Select the correct choice below and fill in the answer box within your choice. places as needed.) is - ta= O Question 6 Do not reject O Question 7 s are ta/2 = Reject is t = ta the null hypothesis. The data O Question 8 television watched by the average person is sufficient evidence to conclude that the amount of the value reported in the study. Question list K Question 2 Question 3 point(s) possible Suppose a study reported that the average person watched 2.96 hours of television per day. A random sample of 15 people gave the number of hours of television watched per day shown. At the 10% significance level, do the data provide sufficient evidence to conclude that the amount of television watched per day last year by the average person differed from the value reported in the study? (Note: x = 4.040 hours and s = 1.424 hours.) Click here to view a partial table of values of t- Submit test 5.0 4.7 3.6 3.4 3.5 4.6 6.3 4.5 6.1 3.4 1.8 5.9 2.5 1.9 3.4 > Question 4 Hot Ha H The test statistic is t = > O Question 5 O Question 6 (Round to two decimal places as needed.) Identify the critical value(s). Select the correc (Round to three decimal places as needed.) OA. The critical value is - t = he answer box within your choice. the same as greater than OB. The critical values are ta/2 = OC. The critical value is to = different from O Question 7 less than O Question 8 the null hypothesis. The data television watched by the average person is nt evidence to conclude that the amount of the value reported in the study. 0 tion list estion 2 K Suppose a study reported that the average person watched 2.96 hours of television per day. A random sample of 15 people gave the number of hours of television watched per day shown. At the 10% significance level, do the data provide sufficient evidence to conclude that the amount of television watched per day last year by the average person differed from the value reported in the study? (Note: x = 4.040 hours and s = 1.424 hours.) Click here to view a partial table of values of to- 5.0 4.7 3.6 3.4 3.5 4.6 6.3 4.5 6.1 3.4 1.8 5.9 2.5 1.9 3.4 stion 3 Set up the hypotheses for the one-mean t-test. stion 4 stion 5 stion 6 stion 7 tion 8 Hot Ha The test statistic is t = (Round to two decimal places as needed.) Identify the critical value(s). Select the correct choice below and fill in the answer box within your choice. (Round to three decimal places as needed.) OA. The critical value is - ta = B. The critical values are ta/2 = C. The critical value is t = . the null hypothesis. The data sufficient evidence to conclude that the amount of 1 of 2 0 of 2 0 of Data table df 10.10 10.05 to.025 10.01 to.005 df 10 1.372 1.812 2.228 2.764 3.169 10 11 1.363 1.796 2.201 2.718 3.106 11 12 1.356 1.782 2.179 2.681 3.055 12 13 1.350 1.771 2.160 2.650 3.012 13 14 1.345 1.761 2.145 2.624 2.977 14 15 1.341 1.753 2.131 2.602 2.947 15 16 1.337 1.746 2.120 2.583 2.921 16 17 1.333 1.740 2.110 2.567 2.898 17 18 1.330 1.734 2.101 2.552 2.878 18 19 1.328 1.729 2.093 2.539 2.861 19 20 1.325 1.725 2.086 2.528 2.845 20 21 1.323 1.721 2.080 2.518 2.831 21 22 1.321 1.717 2.074 2.508 2.819 22 23 1.319 1.714 2.069 2.500 2.807 23 24 1.318 1.711 2.064 2.492 2.797 24 25 1.316 1.708 2.060 2.485 2.787 25 26 1.315 1.706 2.056 2.479 2.779 26 27 1.314 1.703 2.052 2.473 2.771 27 28 1.313 1.701 2.048 2.467 2.763 28 29 1.311 1.699 2.045 2.462 2.756 29 30 1.310 1.697 2.042 2.457 2.750 30 31 1.309 1.696 2.040 2.453 2.744 31 32 1.309 1.694 2.037 2.449 2.738 32 33 1.308 1.692 2.035 2.445 2.733 33 O
Step by Step Solution
There are 3 Steps involved in it

Get step-by-step solutions from verified subject matter experts