

Question: Data Table 2 Part II Observing Standing Waves on the Second String Type of String: Nylon Cord Measured mass of 1.20x10 the length of
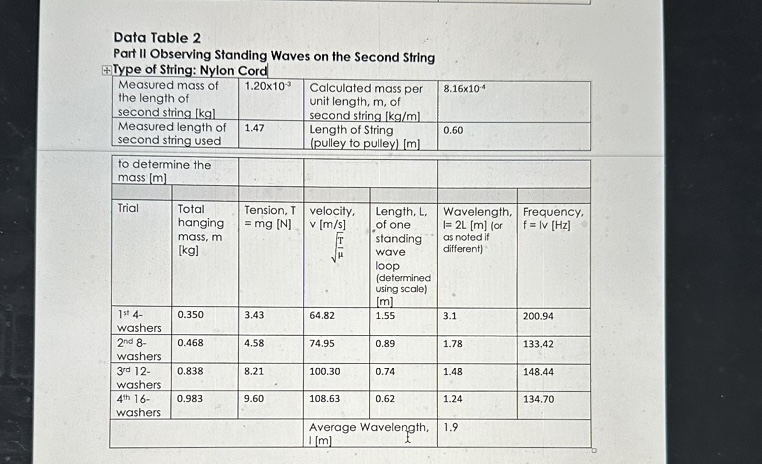
Data Table 2 Part II Observing Standing Waves on the Second String Type of String: Nylon Cord Measured mass of 1.20x10 the length of Calculated mass per unit length, m, of 8.16x10⁻⁴ second string [kgl second string [kg/m] Measured length of 1.47 Length of String 0.60 second string used (pulley to pulley) [m] to determine the Trial mass [m] Total hanging mass, m [kg] Tension, T = mg [N] velocity, v [m/s] of one standing wave Length, L, Wavelength, Frequency, =21 [m] (or f = lv [Hz] as noted if different) loop (determined using scale) [m] 1st 4- 0.350 3.43 64.82 1.55 3.1 200.94 washers 2nd 8- 0.468 4.58 74.95 0.89 1.78 133.42 washers 3rd 12- 0.838 8.21 100.30 0.74 1.48 148.44 washers 4th 16- 0.983 9.60 108.63 0.62 1.24 134.70 washers Average Wavelength, 1.9 [m] 4. Compare the slope of your Data Table 2 graph to the average wavelength (Ave, I) from Data Table 1 by calculating the % Difference. 5. For difficult measurements an error of 10% or less is acceptable; for most experiments an acceptable error is 5% or less. Reflecting on the lab, is the % Difference calculated for the wavelength in Data Table 2 within an acceptable % error? Explain why or why not?
Step by Step Solution
There are 3 Steps involved in it

Get step-by-step solutions from verified subject matter experts