

Question: Data table 2024 2023 Income Statement-partial: $ 22,500 $ 25,000 Net Income Dec. 31, 2024 Dec. 31, 2023 Balance Sheet-partial: $ 260,000 $ 265,000
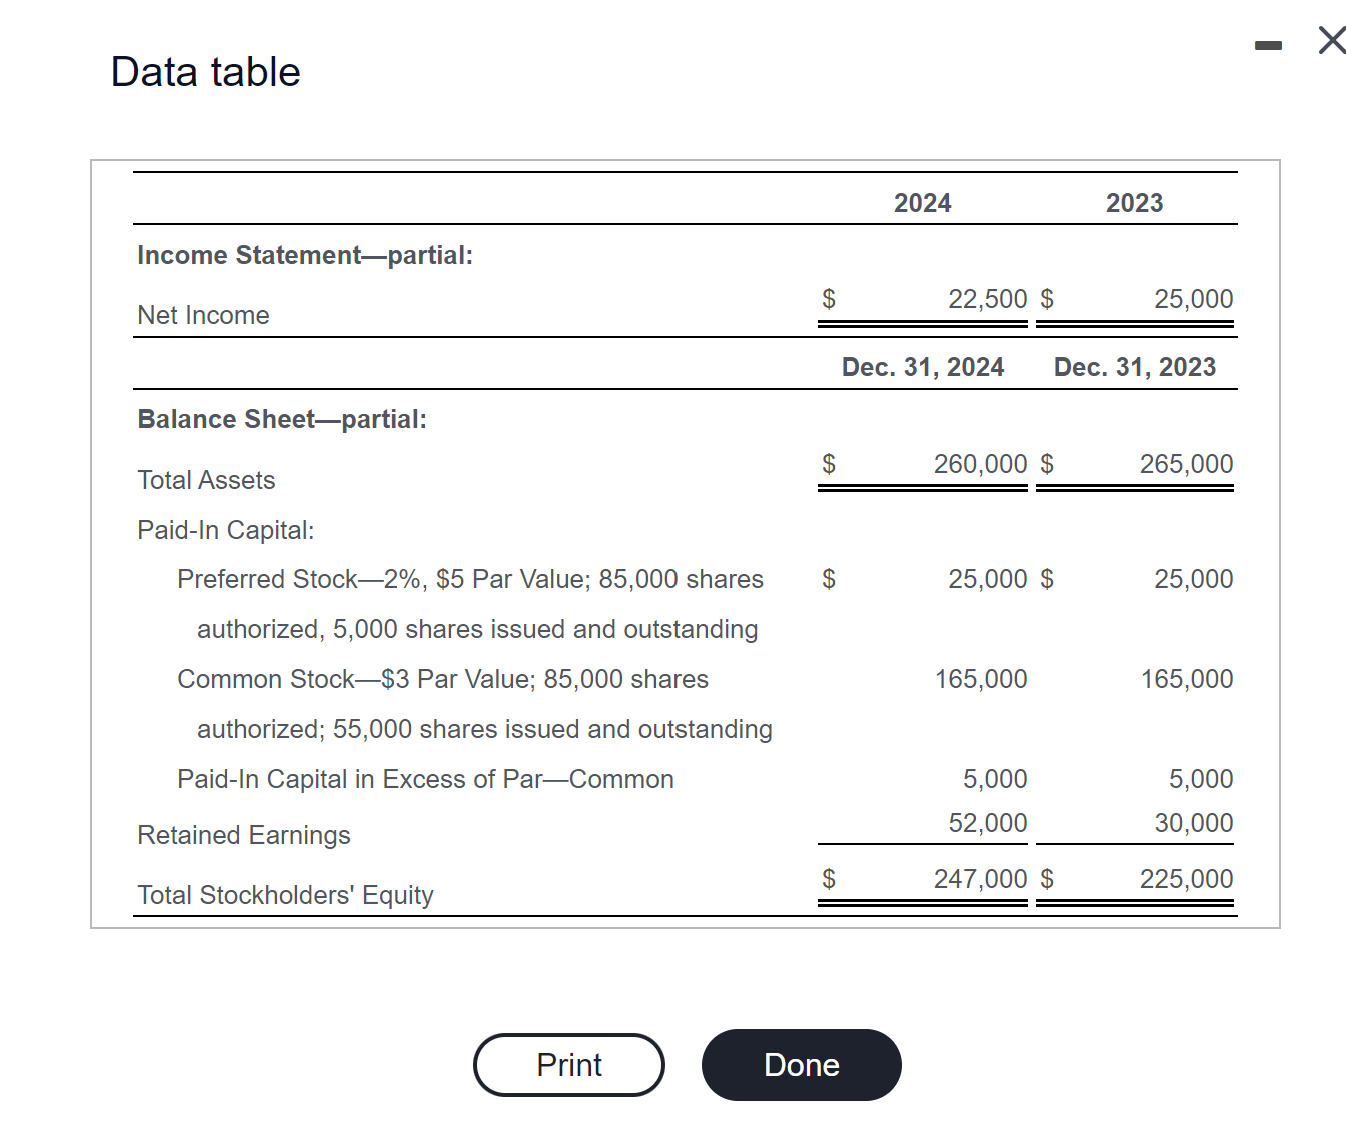
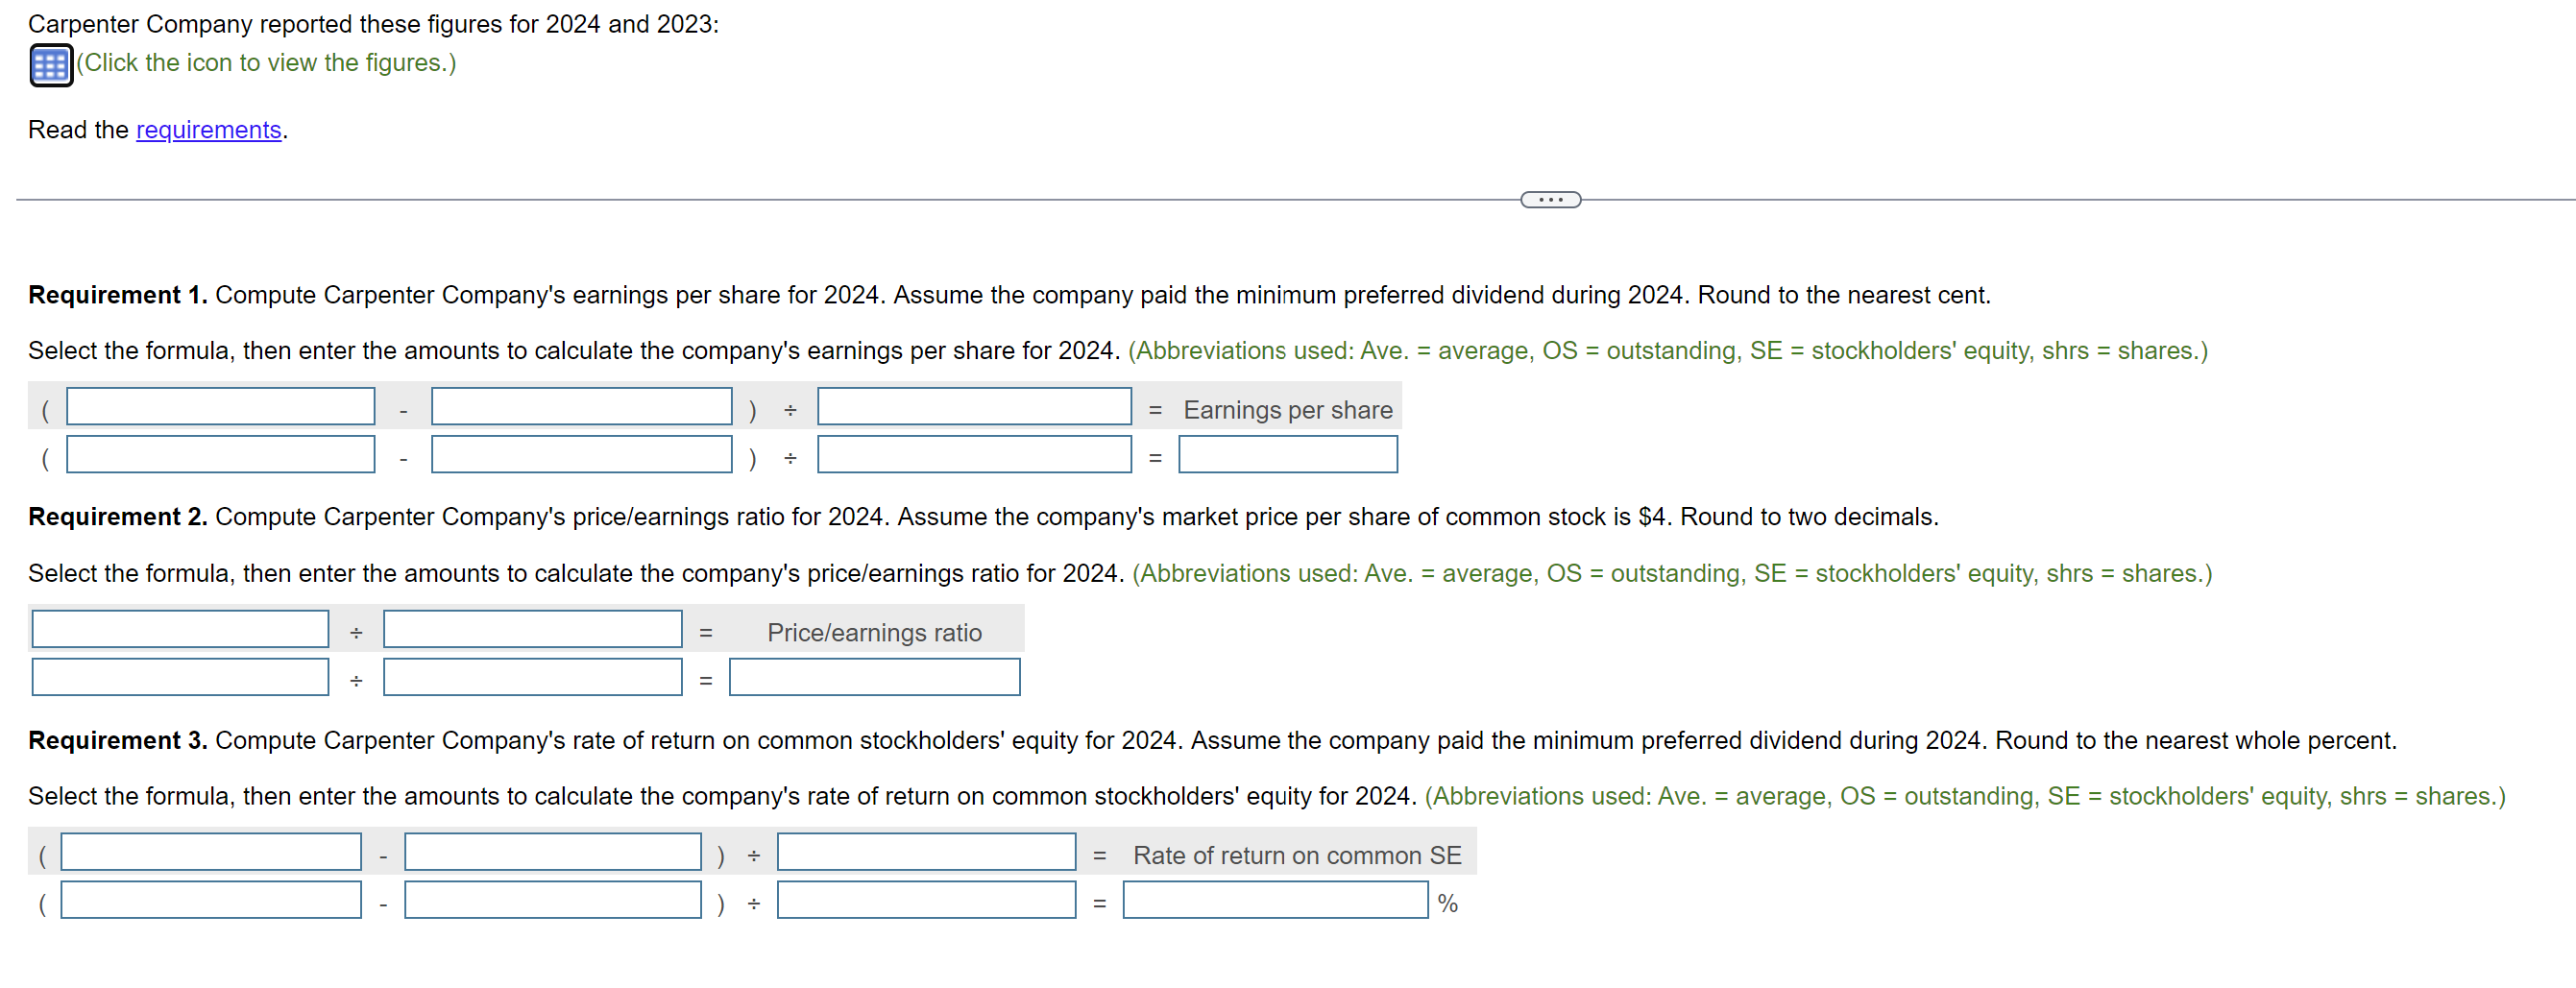
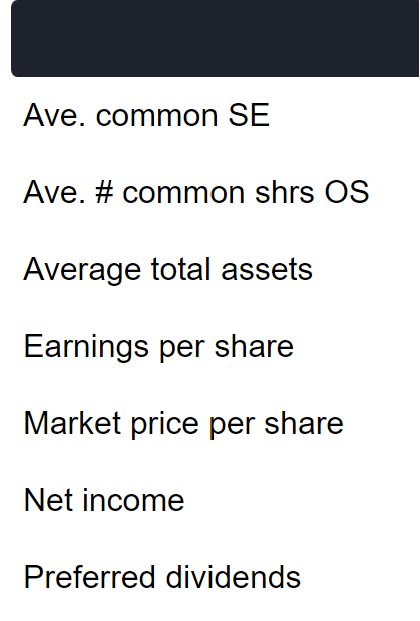
Data table 2024 2023 Income Statement-partial: $ 22,500 $ 25,000 Net Income Dec. 31, 2024 Dec. 31, 2023 Balance Sheet-partial: $ 260,000 $ 265,000 Total Assets Paid-In Capital: Preferred Stock-2%, $5 Par Value; 85,000 shares $ 25,000 $ 25,000 authorized, 5,000 shares issued and outstanding Common Stock-$3 Par Value; 85,000 shares 165,000 165,000 authorized; 55,000 shares issued and outstanding Paid-In Capital in Excess of Par-Common Retained Earnings Total Stockholders' Equity 5,000 52,000 5,000 30,000 $ 247,000 $ 225,000 Print Done - Carpenter Company reported these figures for 2024 and 2023: (Click the icon to view the figures.) Read the requirements. Requirement 1. Compute Carpenter Company's earnings per share for 2024. Assume the company paid the minimum preferred dividend during 2024. Round to the nearest cent. Select the formula, then enter the amounts to calculate the company's earnings per share for 2024. (Abbreviations used: Ave. = average, OS = outstanding, SE = stockholders' equity, shrs = shares.) = Earnings per share = Requirement 2. Compute Carpenter Company's price/earnings ratio for 2024. Assume the company's market price per share of common stock is $4. Round to two decimals. Select the formula, then enter the amounts to calculate the company's price/earnings ratio for 2024. (Abbreviations used: Ave. = average, OS = outstanding, SE = stockholders' equity, shrs = shares.) Price/earnings ratio Requirement 3. Compute Carpenter Company's rate of return on common stockholders' equity for 2024. Assume the company paid the minimum preferred dividend during 2024. Round to the nearest whole percent. Select the formula, then enter the amounts to calculate the company's rate of return on common stockholders' equity for 2024. (Abbreviations used: Ave. = average, OS = outstanding, SE = stockholders' equity, shrs = shares.) = Rate of return on common SE = % Ave. common SE Ave. # common shrs OS Average total assets Earnings per share Market price per share Net income Preferred dividends
Step by Step Solution
There are 3 Steps involved in it

Get step-by-step solutions from verified subject matter experts