

Question: Data Table A Data Table Selected income statement data for the current year: Selected balance sheet and market price data at the end of the
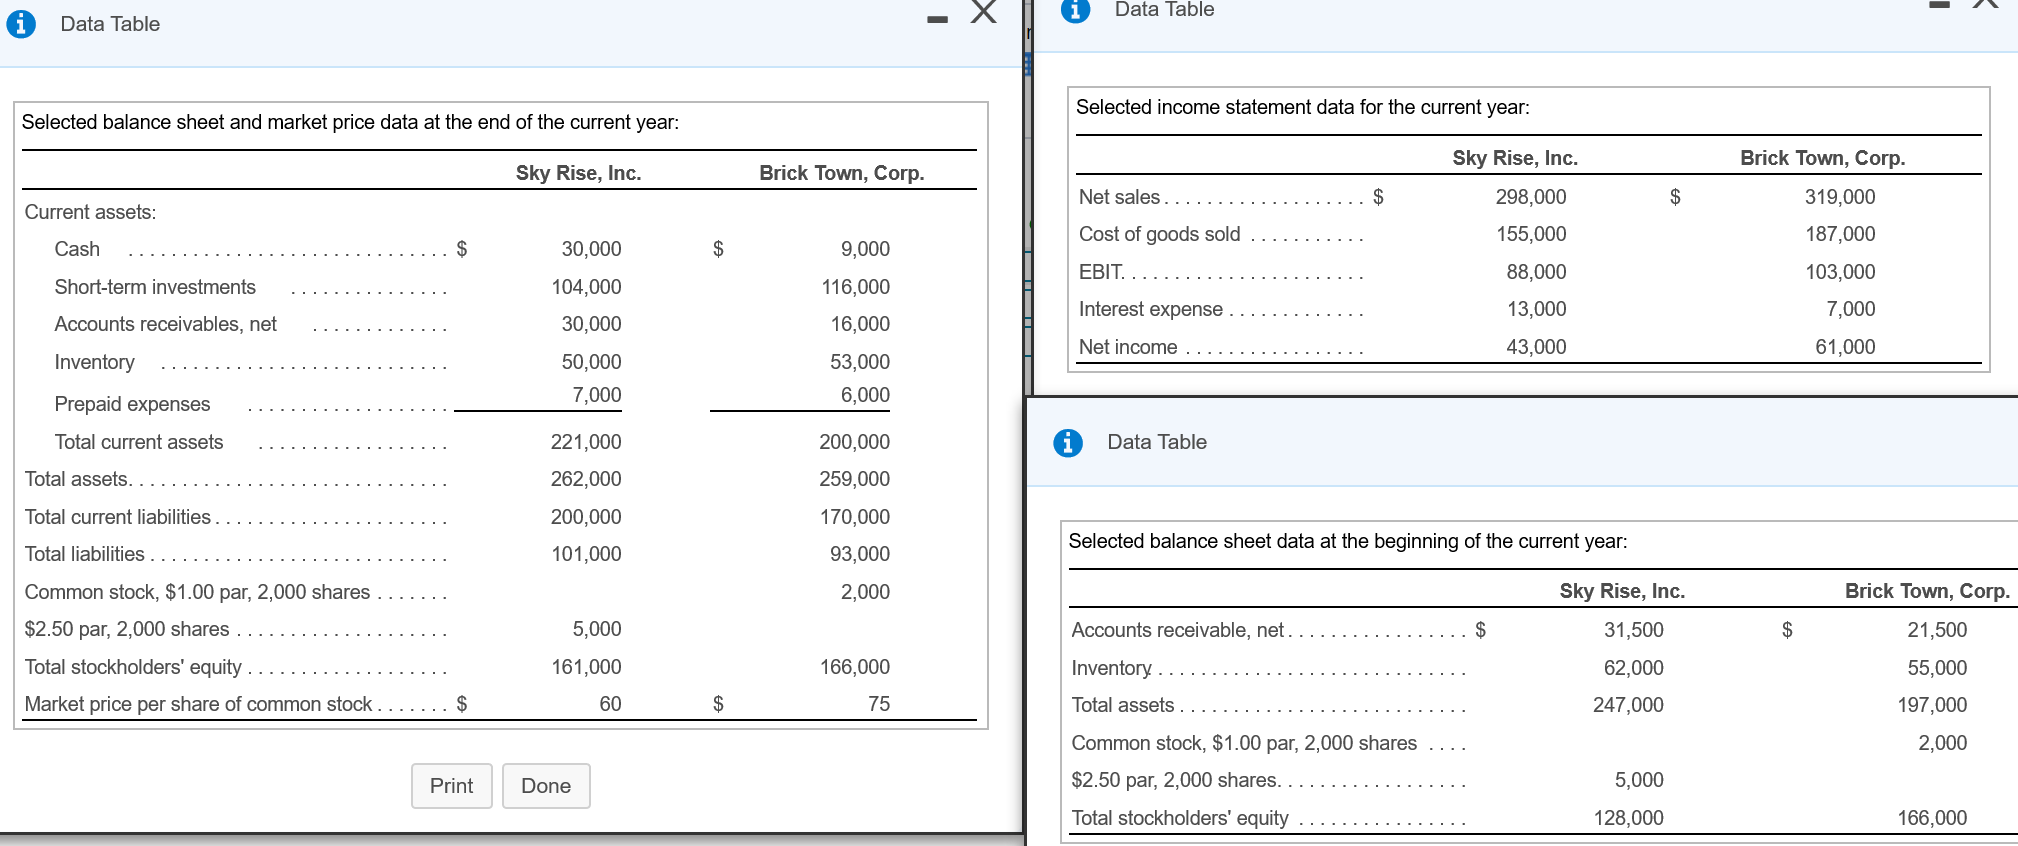
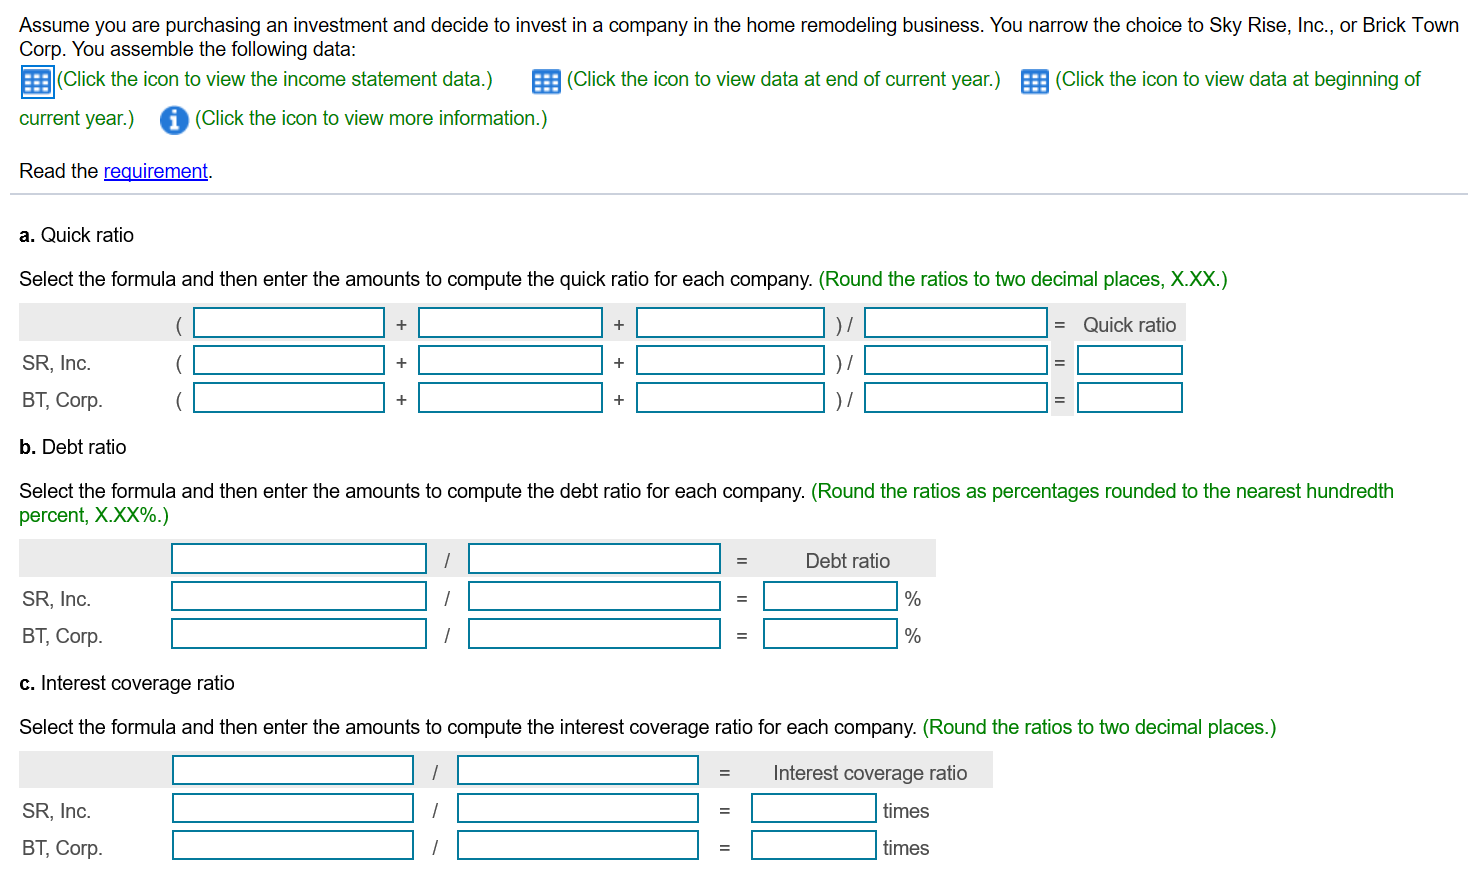
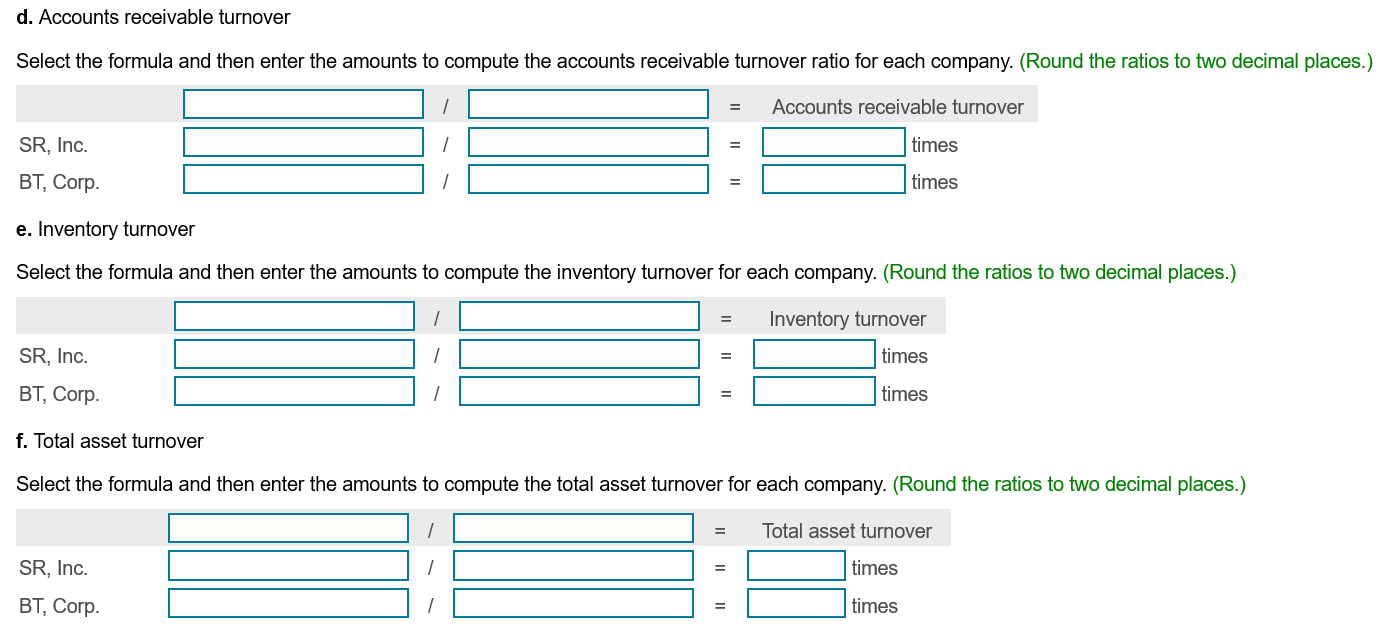
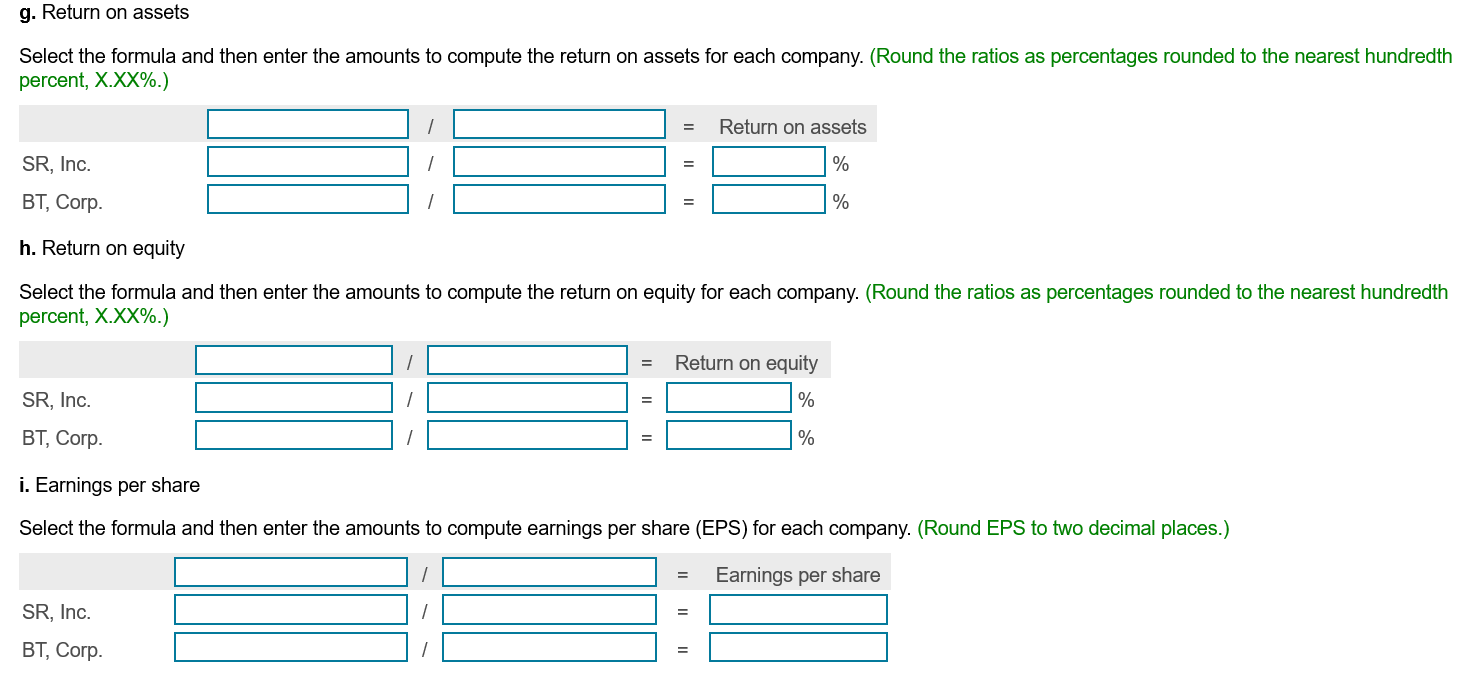
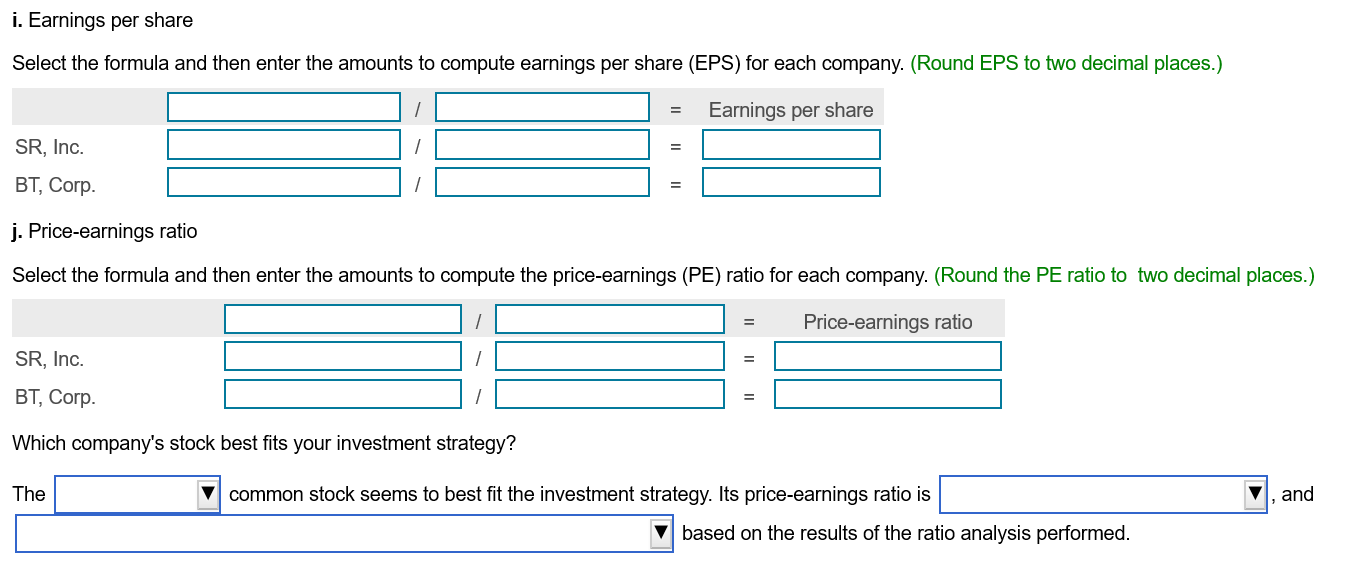
Data Table A Data Table Selected income statement data for the current year: Selected balance sheet and market price data at the end of the current year: Sky Rise, Inc. Brick Town, Corp. Current assets: Net sales ................... $ Cost of goods sold ........... Brick Town, Corp. 319,000 187,000 103,000 Cash .................. .........$ Sky Rise, Inc. 298,000 155,000 88,000 13,000 43,000 EBIT....................... Short-term investments Accounts receivables, net 7,000 30,000 104,000 30,000 50,000 7,000 ............. 9,000 116,000 16,000 53,000 6,000 Interest expense ............. Net income ....... 61,000 Inventory Inventory ........................... Prepaid expenses Total current assets A Data Table 200,000 259,000 Total assets. ............................. 221,000 262,000 200,000 101,000 Total current liabilities..................... 170,000 Selected balance sheet data at the beginning of the current year: Total liabilities ....... Total liabi li . . . . . . . . . . . . . . . . . . . . . . . . . . . . 93,000 2,000 Common stock, $1.00 par, 2,000 shares ...... Brick Town, Corp. $2.50 par, 2,000 shares .................. Sky Rise, Inc. 31,500 62,000 247,000 5,000 161,000 60 Total stockholders' equity ......... equity ............... Market price per share of common stock ....... $ 166,000 75 21,500 55,000 197,000 $ Accounts receivable, net................. $ Inventory Total assets ........... Common stock, $1.00 par, 2,000 shares .... $2.50 par, 2,000 shares.. Total stockholders' equity ................ 2,000 Print Done 5,000 128,000 166,000 Assume you are purchasing an investment and decide to invest in a company in the home remodeling business. You narrow the choice to Sky Rise, Inc., or Brick Town Corp. You assemble the following data: B Click the icon to view the income statement data.) B (Click the icon to view data at end of current year.) 6 (Click the icon to view data at beginning of current year.) (Click the icon to view more information.) Read the requirement. a. Quick ratio Select the formula and then enter the amounts to compute the quick ratio for each company. (Round the ratios to two decimal places, X.XX.) + = Quick ratio + + + )/ SR, Inc. BT, Corp. + + b. Debt ratio Select the formula and then enter the amounts to compute the debt ratio for each company. (Round the ratios as percentages rounded to the nearest hundredth percent, X.XX%.) = Debt ratio SR, Inc. BT, Corp. % % | = c. Interest coverage ratio Select the formula and then enter the amounts to compute the interest coverage ratio for each company. (Round the ratios to two decimal places.) = SR, Inc. BT, Corp. Interest coverage ratio times times d. Accounts receivable turnover Select the formula and then enter the amounts to compute the accounts receivable turnover ratio for each company. (Round the ratios to two decimal places.) Accounts receivable turnover SR, Inc. BT, Corp. IIIIII times times e. Inventory turnover Select the formula and then enter the amounts to compute the inventory turnover for each company. (Round the ratios to two decimal places.) = Inventory turnover times SR, Inc. BT, Corp. times f. Total asset turnover Select the formula and then enter the amounts to compute the total asset turnover for each company. (Round the ratios to two decimal places.) = Total asset turnover times SR, Inc. BT, Corp. times g. Return on assets Select the formula and then enter the amounts to compute the return on assets for each company. (Round the ratios as percentages rounded to the nearest hundredth percent, X.XX%.) = Return on assets SR, Inc. BT, Corp. h. Return on equity Select the formula and then enter the amounts to compute the return on equity for each company. (Round the ratios as percentages rounded to the nearest hundredth percent, X.XX%.) Return on equity SR, Inc. BT, Corp. i. Earnings per share Select the formula and then enter the amounts to compute earnings per share (EPS) for each company. (Round EPS to two decimal places.) = Earnings per share SR, Inc. BT, Corp. i. Earnings per share Select the formula and then enter the amounts to compute earnings per share (EPS) for each company. (Round EPS to two decimal places.) Earnings per share SR, Inc. BT, Corp. j. Price-earnings ratio Select the formula and then enter the amounts to compute the price-earnings (PE) ratio for each company. (Round the PE ratio to two decimal places.) Price-earnings ratio SR, Inc. BT, Corp. Which company's stock best fits your investment strategy? The common stock seems to best fit the investment strategy. Its price-earnings ratio is V, and based on the results of the ratio analysis performed
Step by Step Solution
There are 3 Steps involved in it

Get step-by-step solutions from verified subject matter experts