

Question: Data Table A (In millions) 2019 2018 2017 2016 $ 9,460 $ Revenue Net Income 9,675 $ 7,310 9,125 $ 5,075 8,925 4,340 6,870 i
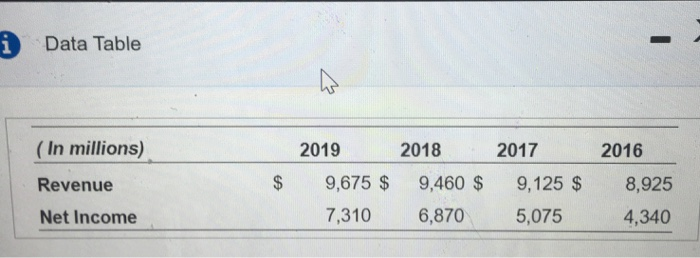
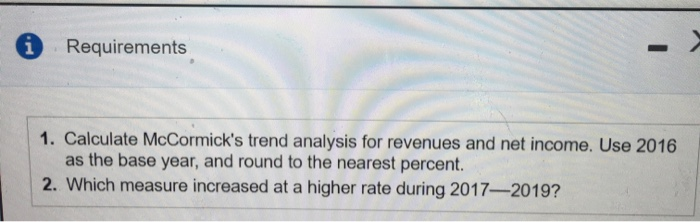
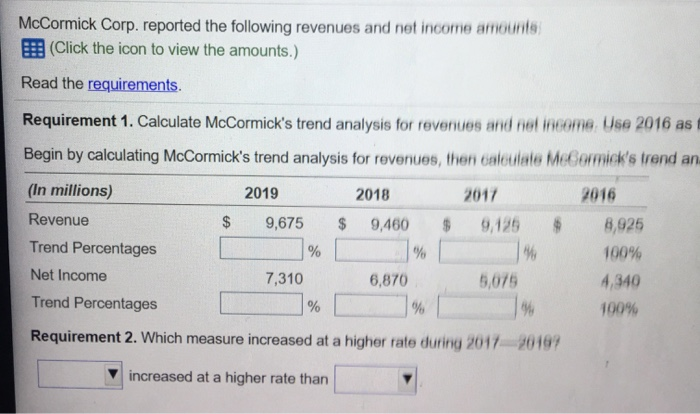
Data Table A (In millions) 2019 2018 2017 2016 $ 9,460 $ Revenue Net Income 9,675 $ 7,310 9,125 $ 5,075 8,925 4,340 6,870 i Requirements 1. Calculate McCormick's trend analysis for revenues and net income. Use 2016 as the base year, and round to the nearest percent. 2. Which measure increased at a higher rate during 2017-2019? McCormick Corp. reported the following revenues and net income amounts (Click the icon to view the amounts.) Read the requirements. Requirement 1. Calculate McCormick's trend analysis for revenues and net income Use 2016 as Begin by calculating McCormick's trend analysis for revenues, then caloulale McCormick's trend an 2019 2018 2017 9,675 9,460 $ (In millions) Revenue Trend Percentages Net Income Trend Percentages % 7,310 2016 8,925 100% 4,340 100% 6,870 % 5,075 9 % Requirement 2. Which measure increased at a higher rate during 2017 20197 increased at a higher rate than
Step by Step Solution
There are 3 Steps involved in it

Get step-by-step solutions from verified subject matter experts