

Question: Data table A through F 5 (e) Draw a bar graph of the conditional distribution found in part (d). Let the red bars (left most)
Data table A through F 5
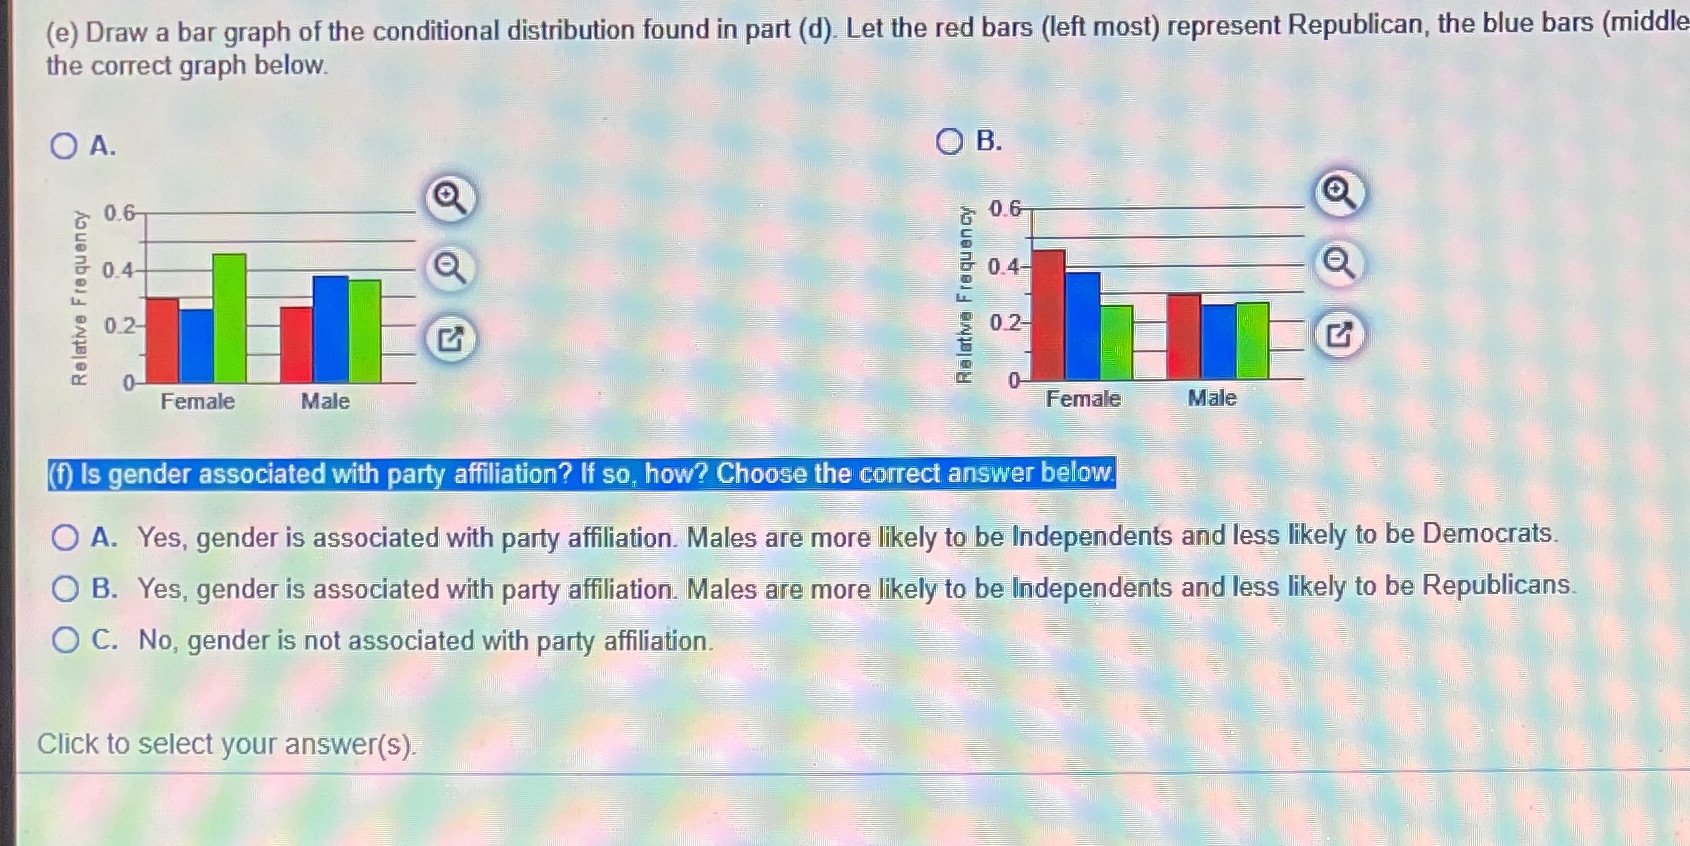
(e) Draw a bar graph of the conditional distribution found in part (d). Let the red bars (left most) represent Republican, the blue bars (middle the correct graph below. O A. O B. O O 0.6 0.6 0.4 0.4- Relative Frequency Relative Frequency 02 0.2- 0- Female Male Female Male f) Is gender associated with party affiliation? If so, how? Choose the correct answer below. O A. Yes, gender is associated with party affiliation. Males are more likely to be Independents and less likely to be Democrats. O B. Yes, gender is associated with party affiliation. Males are more likely to be Independents and less likely to be Republicans. O C. No, gender is not associated with party affiliation. Click to select your answer(s)
Step by Step Solution
There are 3 Steps involved in it

Get step-by-step solutions from verified subject matter experts