

Question: * Data Table (Click on the following icon in order to copy its contents into a spreadsheet.) Partial Income Statement Year Ending 2017 Sales revenue
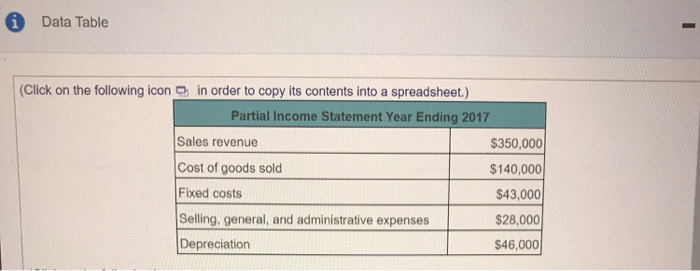
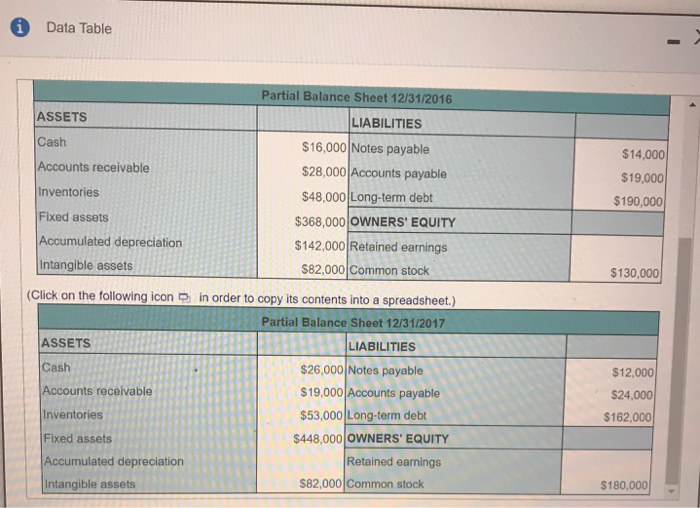
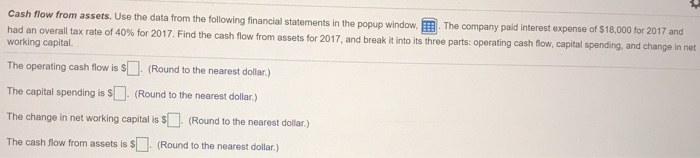
* Data Table (Click on the following icon in order to copy its contents into a spreadsheet.) Partial Income Statement Year Ending 2017 Sales revenue $350,000 Cost of goods sold $140,000 Fixed costs $43,000 Selling, general, and administrative expenses $28,000 Depreciation $46,000 Data Table Partial Balance Sheet 12/31/2016 ASSETS LIABILITIES $14,000 $19,000 $190,000 $130,000 Cash $16,000 Notes payable Accounts receivable $28,000 Accounts payable Inventories $48,000 Long-term debt Fixed assets $368,000 OWNERS' EQUITY Accumulated depreciation $ 142,000 Retained earnings Intangible assets $82,000 Common stock (Click on the following icon in order to copy its contents into a spreadsheet.) Partial Balance Sheet 12/31/2017 ASSETS LIABILITIES Cash $26,000 Notes payable Accounts receivable $19,000 Accounts payable Inventories $53,000 Long-term debt Fixed assets $448,000 OWNERS' EQUITY Accumulated depreciation Retained earnings Intangible assets $82,000 Common stock $12,000 $24,000 $162,000 $180,000 Cash flow from assets. Use the data from the following financial statements in the popup window, The company paid interest expense of $18,000 for 2017 and had an overall tax rate of 40% for 2017. Find the cash flow from assets for 2017, and break it into its three parts: operating cash flow, capital spending, and change in net working capital The operating cash flow is $. (Round to the nearest dollar.) The capital spending is $. (Round to the nearest dollar.) The change in net working capital is $ (Round to the nearest dollar.) The cash flow from assets is (Round to the nearest dollar.)
Step by Step Solution
There are 3 Steps involved in it

Get step-by-step solutions from verified subject matter experts