

Question: Data table (Click on the icon here in order to copy the contents of the data table below into a spreadsheet.) Term structure of interest
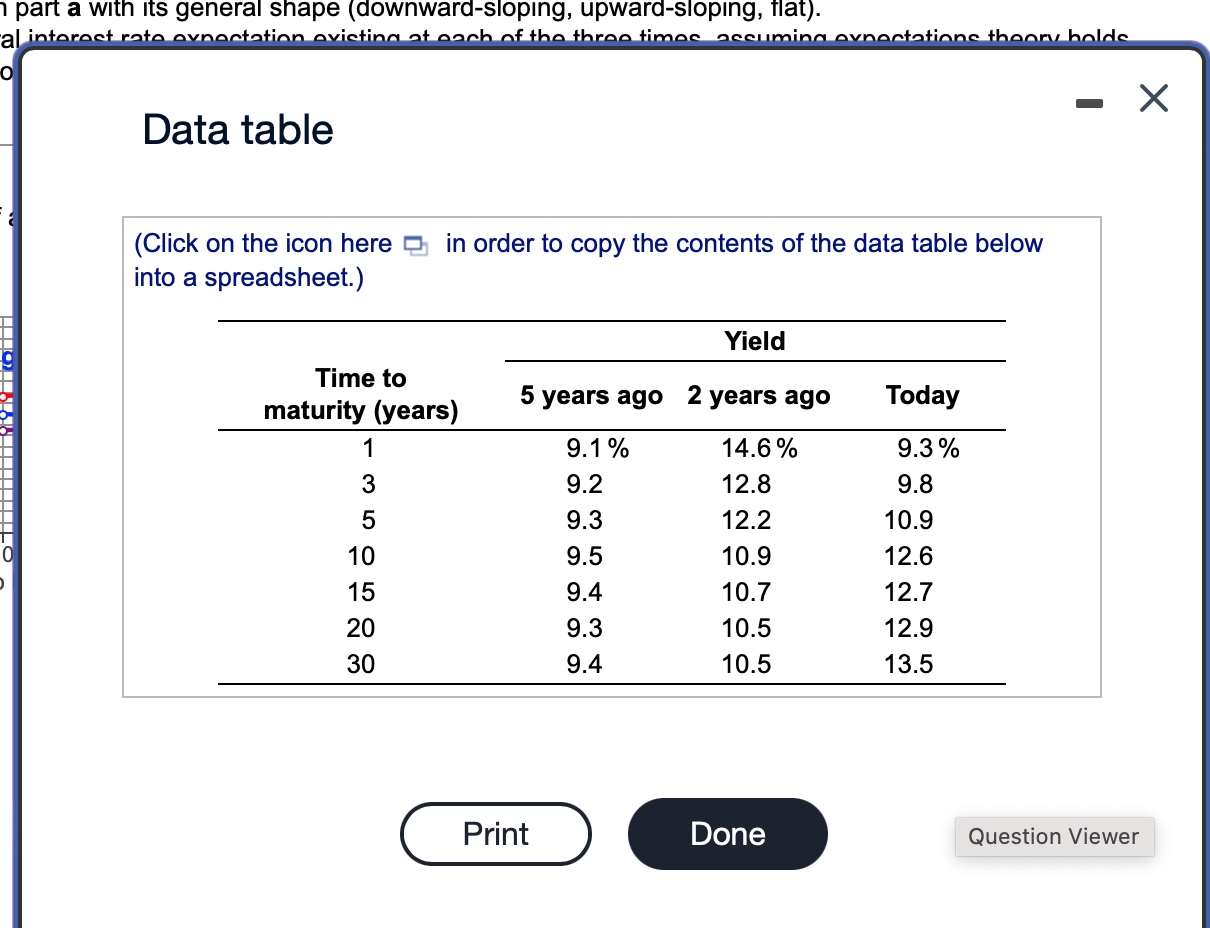
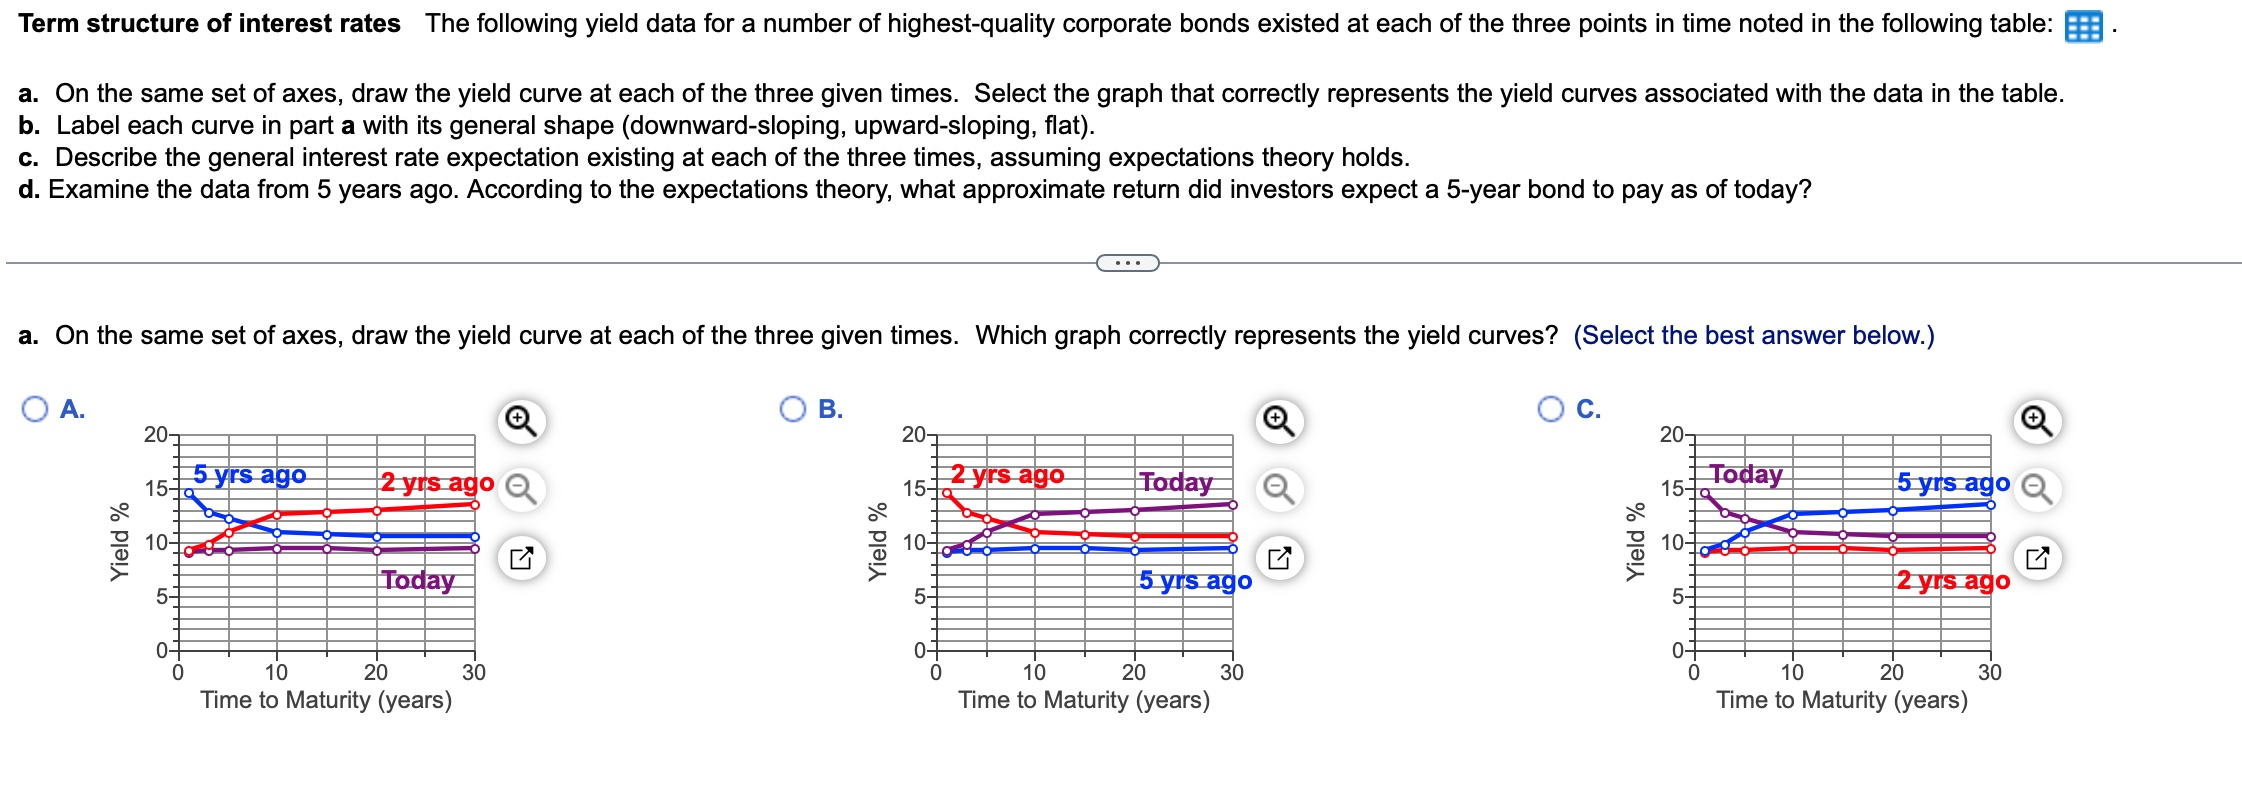
Data table (Click on the icon here in order to copy the contents of the data table below into a spreadsheet.) Term structure of interest rates The following yield data for a number of highest-quality corporate bonds existed at each of the three points in time noted in the following table: a. On the same set of axes, draw the yield curve at each of the three given times. Select the graph that correctly represents the yield curves associated with the data in the table. b. Label each curve in part a with its general shape (downward-sloping, upward-sloping, flat). c. Describe the general interest rate expectation existing at each of the three times, assuming expectations theory holds. d. Examine the data from 5 years ago. According to the expectations theory, what approximate return did investors expect a 5 -year bond to pay as of today
Step by Step Solution
There are 3 Steps involved in it

Get step-by-step solutions from verified subject matter experts