

Question: Data table (Click on the icon here in order to copy the contents of the data table below into a spreadsheet.) 2012-2021: a. Which of
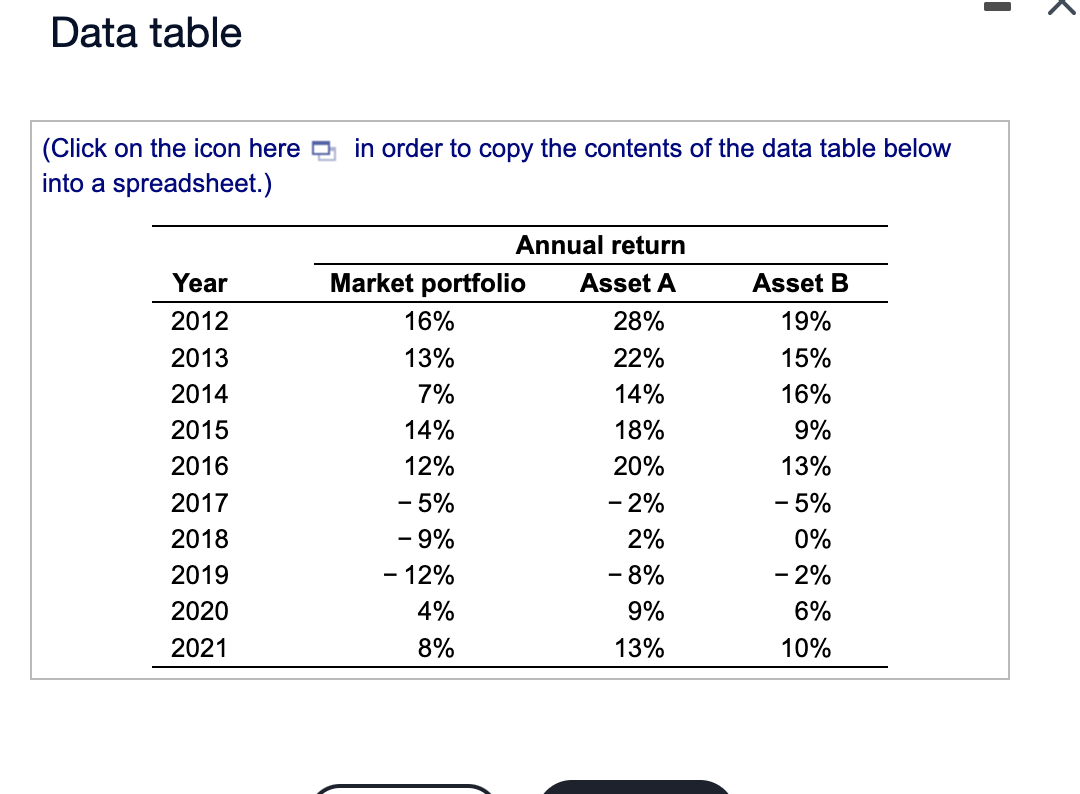
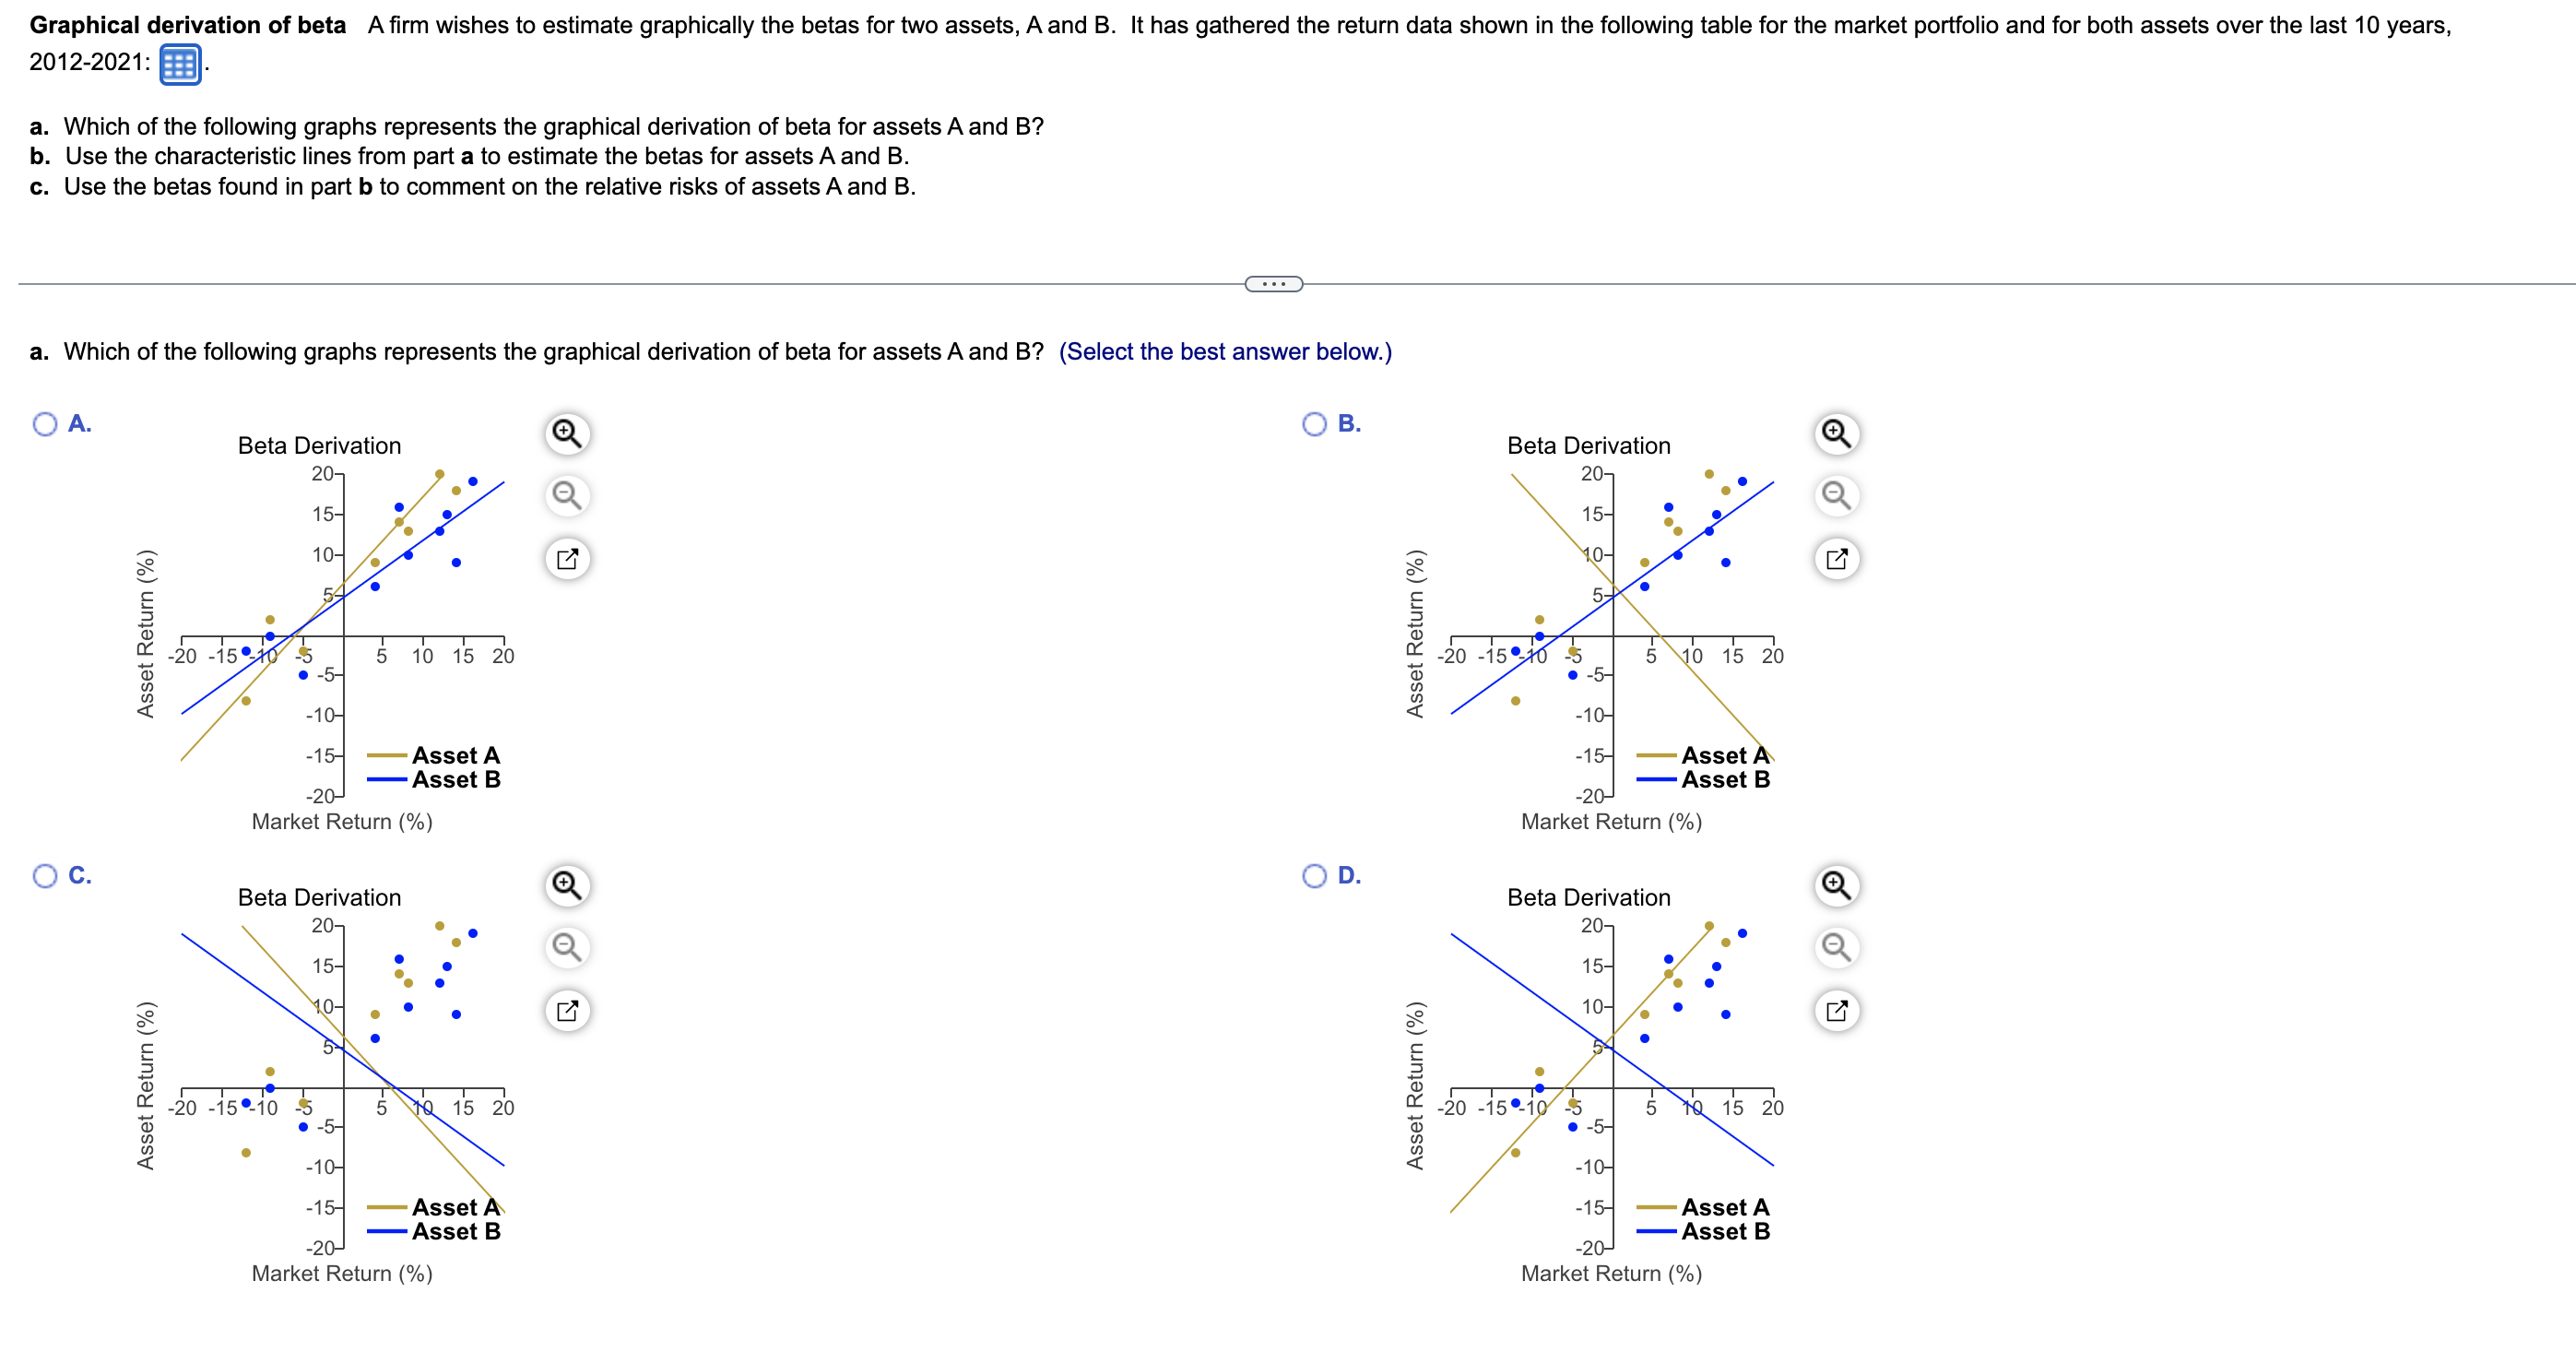
Data table (Click on the icon here in order to copy the contents of the data table below into a spreadsheet.) 2012-2021: a. Which of the following graphs represents the graphical derivation of beta for assets A and B ? b. Use the characteristic lines from part a to estimate the betas for assets A and B. c. Use the betas found in part b to comment on the relative risks of assets A and B
Step by Step Solution
There are 3 Steps involved in it
1 Expert Approved Answer
Step: 1 Unlock

Question Has Been Solved by an Expert!
Get step-by-step solutions from verified subject matter experts
Step: 2 Unlock
Step: 3 Unlock