

Question: Data table (Click on the icon here in order to copy the contents of the data table below into a spreadsheet.) Camera R Cameras Amount
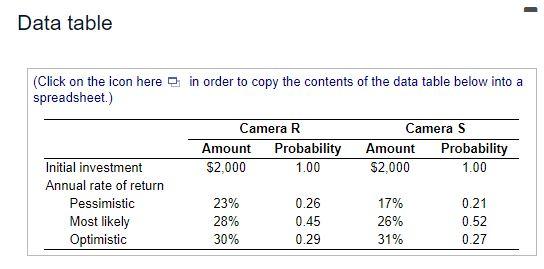
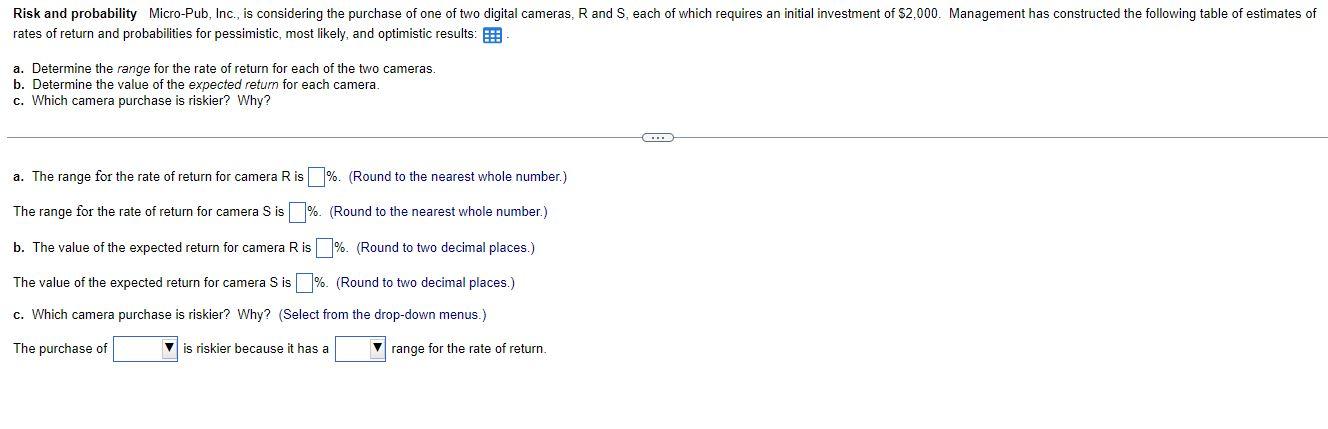
Data table (Click on the icon here in order to copy the contents of the data table below into a spreadsheet.) Camera R Cameras Amount Probability Amount Probability Initial investment $2,000 1.00 $2,000 1.00 Annual rate of return Pessimistic 23% 0.26 17% 0.21 Most likely 28% 0.45 26% 0.52 Optimistic 30% 0.29 31% 0.27 Risk and probability Micro-Pub, Inc., is considering the purchase of one of two digital cameras, R and S, each of which requires an initial investment of $2,000. Management has constructed the following table of estimates of rates of return and probabilities for pessimistic, most likely, and optimistic results: a. Determine the range for the rate of return for each of the two cameras. b. Determine the value of the expected return for each camera, c. Which camera purchase is riskier? Why? a. The range for the rate of return for camera Ris %. (Round to the nearest whole number.) The range for the rate of return for camera Sis%. (Round to the nearest whole number.) b. The value of the expected return for camera Ris%. (Round to two decimal places.) The value of the expected return for camera Sis%. (Round to two decimal places.) c. Which camera purchase is riskier? Why? (Select from the drop-down menus.) The purchase of is riskier because it has a range for the rate of return
Step by Step Solution
There are 3 Steps involved in it

Get step-by-step solutions from verified subject matter experts