

Question: Data Table (Click on the icon to import the table into a spreadsheet) 2006 Australia's Current Account Assumptions (millions USD) 2005 2007 2008 2009 2010
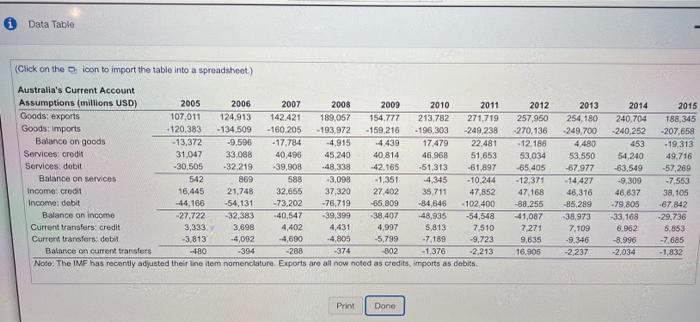
Data Table (Click on the icon to import the table into a spreadsheet) 2006 Australia's Current Account Assumptions (millions USD) 2005 2007 2008 2009 2010 2011 Goods, exports 107,011 124.913 142.421 189,057 154.777 213,782 271,719 Goods: Imports - 120.383 - 134,509 - 160 205 - 193.972 -159,216 -196,303 -249,238 Balance on goods -13,372 -9,596 -17.784 -4.915 -4.439 17 479 22.481 Services: credit 31,047 33.088 40,496 45.240 40.814 46.968 51.653 Services dobit -30,505 -32.219 39,908 -48,338 -42.165 -51,313 -61,897 Balance on servicos 542 869 588 -3,098 -1.351 4,345 - 10.244 Income: creo 16,445 21.748 32,655 37,320 27.402 35.711 47,852 Income: debit -44,166 -54.131 -73.202 -76.719 -65.809 -84,646 102.400 Balance on income -27.722 -32,383 -40,547 -39,399 -38,407 48,935 -54,548 Current transfers. credit 3,333 3,698 4,402 4,431 5,813 7.510 Current transfers debit -3,813 -4,092 -4,690 -4,805 -5,799 -7.189 -9,723 Balance on current transfers -180 -394 -288 -374 -802 -1,376 -2.213 Noto: The IMF has recently adjusted their line dem nomenclature Exports are all now noted as credits imports as debits 2012 257,950 270.136 - 12.186 53 034 -65 405 -12.371 47.168 -88.255 41,087 7.271 9,635 16.905 2013 254,180 249.700 4,480 53,550 -67 977 -14 427 46,316 -85,289 38,973 7.109 -9.346 -2,237 2014 240,704 -240.252 453 54,240 -83,549 -9,309 46,637 -79,805 -33,168 8.962 -8.996 -2,034 2015 188,345 -207.658 -19,313 49.716 -57,260 -7.553 38.105 -67.842 -29,736 5.853 -7.685 -1,832 4.997 Print Done
Step by Step Solution
There are 3 Steps involved in it

Get step-by-step solutions from verified subject matter experts