

Question: Data table (Click the icon here in order to copy the contents of the data table below into a spreadsheet.) This table, shows 2017 total
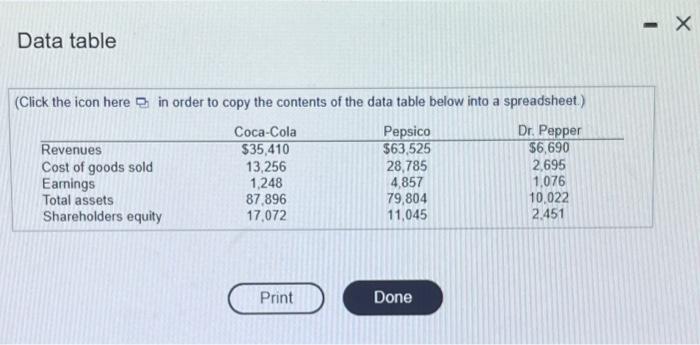
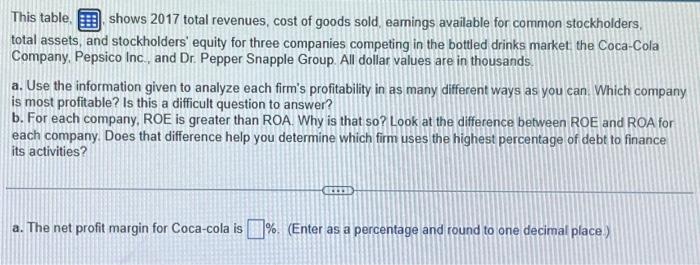
Data table (Click the icon here in order to copy the contents of the data table below into a spreadsheet.) This table, shows 2017 total revenues, cost of goods sold, eamings available for common stockholders, total assets, and stockholders' equity for three companies competing in the bottled drinks market the Coca-Cola Company, Pepsico Inc., and Dr. Pepper Snapple Group. All dollar values are in thousands. a. Use the information given to analyze each firm's profitability in as many different ways as you can. Which company is most profitable? Is this a difficult question to answer? b. For each company, ROE is greater than ROA. Why is that so? Look at the difference between ROE and ROA for each company. Does that difference help you determine which firm uses the highest percentage of debt to finance its activities? a. The net profit margin for Coca-cola is %. (Enter as a percentage and round to one decimal place.)
Step by Step Solution
There are 3 Steps involved in it

Get step-by-step solutions from verified subject matter experts