

Question: Data table (Click the icon here in order to copy the contents of the data table below into a spreadsheet.) Using the individual tax rate
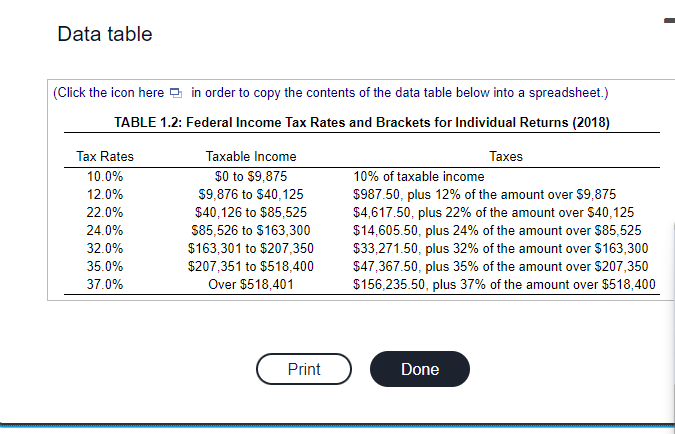
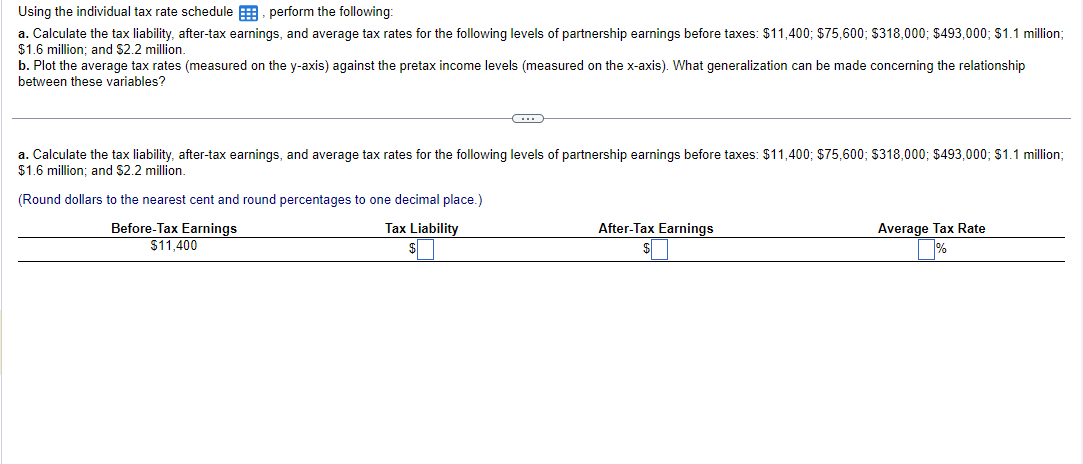
Data table (Click the icon here in order to copy the contents of the data table below into a spreadsheet.) Using the individual tax rate schedule , perform the following: a. Calculate the tax liability, after-tax earnings, and average tax rates for the following levels of partnership earnings before taxes: $11,400; $75,600; $318,000; $493,000; $1.1 million; $1.6 million; and \$2.2 million. b. Plot the average tax rates (measured on the y-axis) against the pretax income levels (measured on the x-axis). What generalization can be made concerning the relationship between these variables? a. Calculate the tax liability, after-tax earnings, and average tax rates for the following levels of partnership earnings before taxes: $11,400; $75,600; $318,000; $493,000; $1.1 million; $1.6 million; and \$2.2 million. (Round dollars to the nearest cent and round percentages to one decimal place.)
Step by Step Solution
There are 3 Steps involved in it

Get step-by-step solutions from verified subject matter experts