

Question: Data Table Current Year Previous Year Balance Sheet Cash. . . . . . . . . . . . . . . . .
Data Table
|
| Current Year | Previous Year |
| Balance Sheet |
|
|
| Cash. . . . . . . . . . . . . . . . . | $25,000 | $33,000 |
| Short-term investments. . . . | 16,000 | 27,000 |
| Accounts receivables, net. . . | 55,000 | 74,000 |
| Inventory. . . . . . . . . . . . . . | 55,000 | 51,000 |
| Prepaid expenses. . . . . . . . . | 5,000 | 13,000 |
| Total current assets. . . . . . . . | 156,000 | 198,000 |
| Accounts payable. . . . . . . . . | 41,000 | 38,000 |
| Total current liabilities. . . . . | 95,000 | 89,000 |
| Income Statement |
|
|
| Net sales. . . . . . . . . . . . . . . . | $464,000 |
|
| Cost of goods sold. . . . . . . . . | 370,000 |
|
| Net income. . . . . . . . . . . . . . . | 55,000 |
|
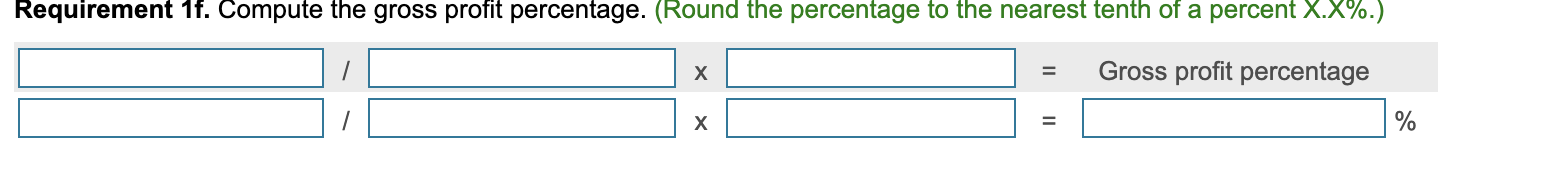
Requirement 1f. Compute the gross profit percentage. (Round the percentage to the nearest tenth of a percent X.X%.) Gross profit percentage %
Step by Step Solution
There are 3 Steps involved in it

Get step-by-step solutions from verified subject matter experts