

Question: Data Table Demand State Low Medium High Probability of State 10% 56% 34% NPV Estimate $(309,000) $190,000 $394,000 (Click on the icon in order to
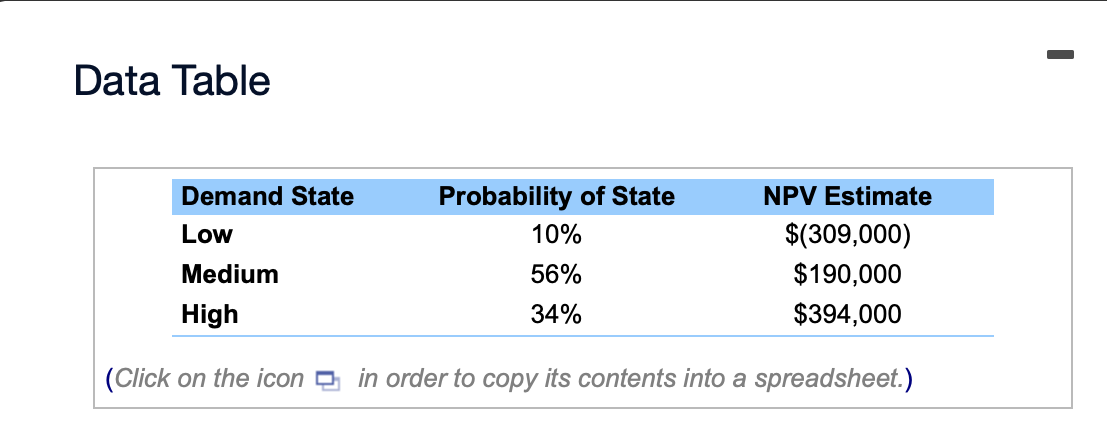
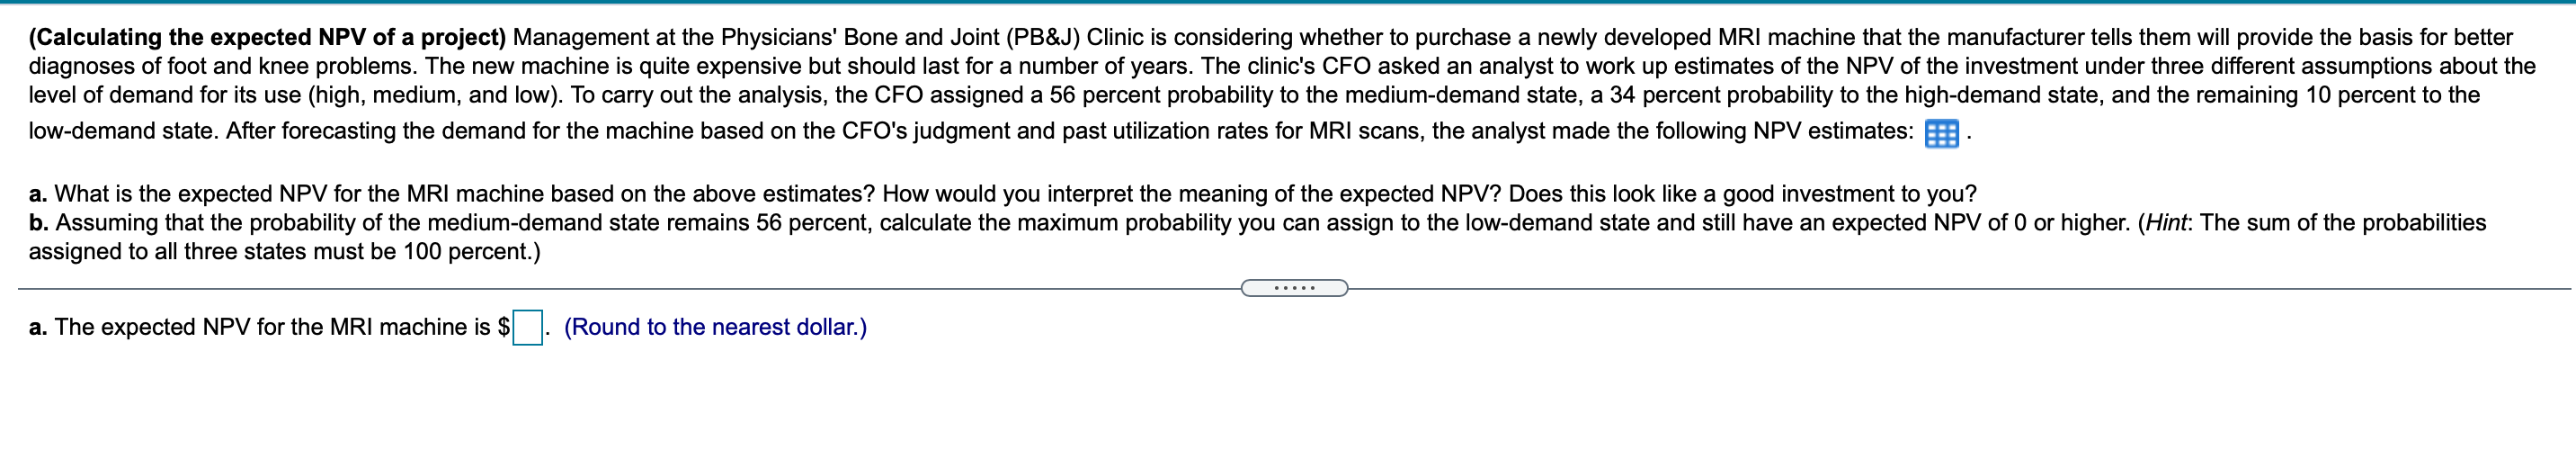
Data Table Demand State Low Medium High Probability of State 10% 56% 34% NPV Estimate $(309,000) $190,000 $394,000 (Click on the icon in order to copy its contents into a spreadsheet.) (Calculating the expected NPV of a project) Management at the Physicians' Bone and Joint (PB&J) Clinic is considering whether to purchase a newly developed MRI machine that the manufacturer tells them will provide the basis for better diagnoses of foot and knee problems. The new machine is quite expensive but should last for a number of years. The clinic's CFO asked an analyst to work up estimates of the NPV of the investment under three different assumptions about the level of demand for its use (high, medium, and low). To carry out the analysis, the CFO assigned a 56 percent probability to the medium-demand state, a 34 percent probability to the high-demand state, and the remaining 10 percent to the low-demand state. After forecasting the demand for the machine based on the CFO's judgment and past utilization rates for MRI scans, the analyst made the following NPV estimates: 3 a. What is the expected NPV for the MRI machine based on the above estimates? How would you interpret the meaning of the expected NPV? Does this look like a good investment to you? b. Assuming that the probability of the medium-demand state remains 56 percent, calculate the maximum probability you can assign to the low-demand state and still have an expected NPV of 0 or higher. (Hint: The sum of the probabilities assigned to all three states must be 100 percent.) a. The expected NPV for the MRI machine is $ (Round to the nearest dollar.)
Step by Step Solution
There are 3 Steps involved in it

Get step-by-step solutions from verified subject matter experts