

Question: Data Table he (Click on the icon located on the top-right corner of the data table below in order to copy its contents into a
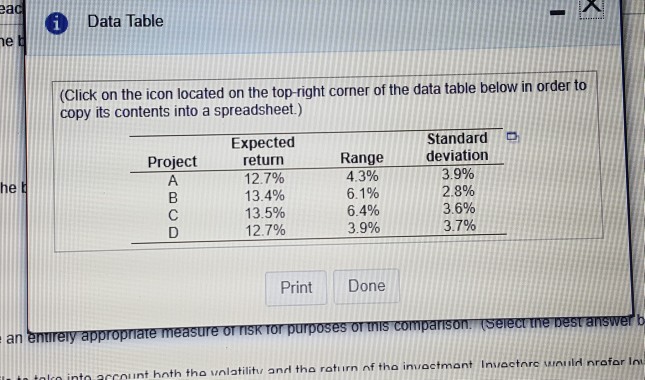
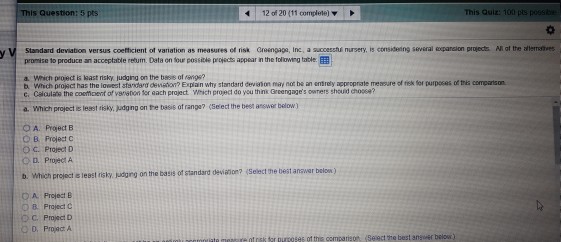
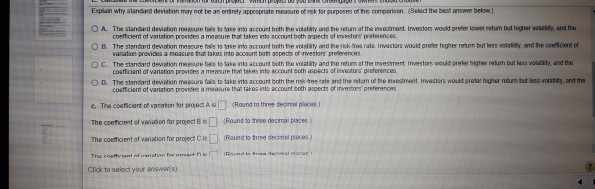

Data Table he (Click on the icon located on the top-right corner of the data table below in order to copy its contents into a spreadsheet) Expected return 12.7% 13.4% 13.5% 12.7% Range 4.3% 6.1% 6.4% 3.9% Standard deviation 3.9% 2.8% 3.6% 3.7% Project he Print Done an enurery appropriate measure OT TIsk Tor purposes or mis comparison.serecrine punposes ONmS COmparison/Selecotne bestanswer b nd th ratiirn nf tha ini, ctma nt Insiaetnrc urild nraforli tolro into account hnth the unlatilitu a
Step by Step Solution
There are 3 Steps involved in it
1 Expert Approved Answer
Step: 1 Unlock

Question Has Been Solved by an Expert!
Get step-by-step solutions from verified subject matter experts
Step: 2 Unlock
Step: 3 Unlock