

Question: data table in second picture :) Options profits and losses For each of the 100-share aper s shown in the follo ing table,use the underlying
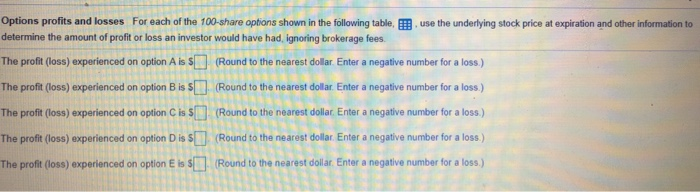
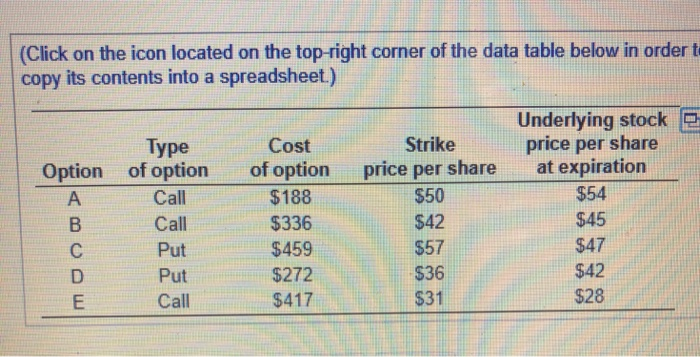
Options profits and losses For each of the 100-share aper s shown in the follo ing table,use the underlying stock price at expiration and other information to determine the amount of profit or loss an investor would have had, ignoring brokerage fees. The profit (loss) experienced on option A is s (Round to the nearest dollar Enter a negative number for a loss) The profit (loss) experienced on option B is s (Round to the nearest dollar. Enter a negative number for a loss ) The profit (loss) experienced on option C is $ (Round to the nearest dollar. Enter a negative number for a loss) The profit (loss) experienced on option D is s Round to the nearest dollar Enter a negative number for a loss) The profit(loss) experienced on option E is s(Round to the nearest dollar. Enter a negative number for a loss.) (Click on the icon located on the top-right corner of the data table below in order t copy its contents into a spreadsheet) Underlying stock B price per share at expiration Strike Type of option Call Call Put Put Call Cost price per share $50 $42 $57 $36 $31 of option Option $54 $45 $47 $42 $28 $188 $336 $459 $272 $417
Step by Step Solution
There are 3 Steps involved in it

Get step-by-step solutions from verified subject matter experts