

Question: Data table ( Lilck on the icon Iocated on the top-rignt corner or the aata tapre above in order to copy its contents into a
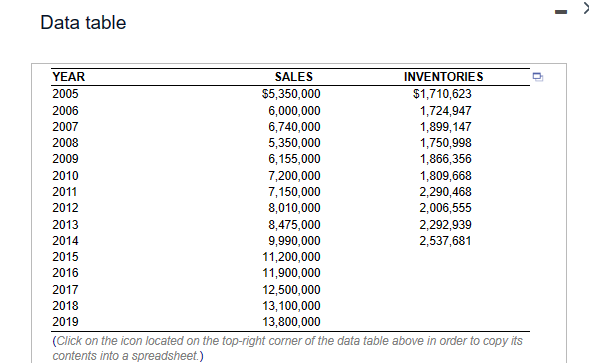
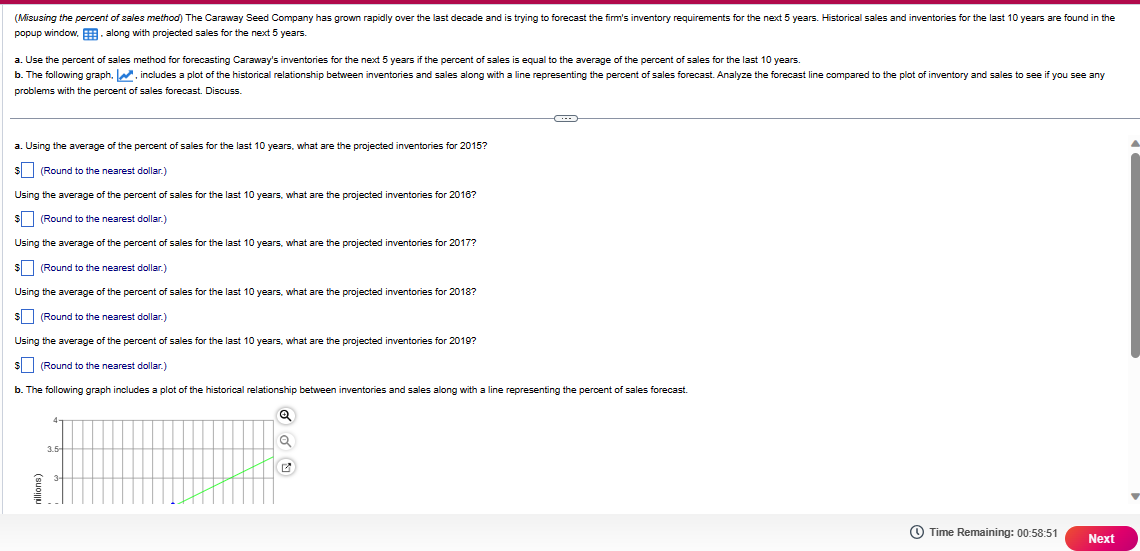
Data table ( Lilck on the icon Iocated on the top-rignt corner or the aata tapre above in order to copy its contents into a spreadsheet.) popup window, , along with projected sales for the next 5 years. problems with the percent of sales forecast. Discuss. a. Using the average of the percent of sales for the last 10 years, what are the projected inventories for 2015 ? s. (Round to the nearest dollar.) Using the average of the percent of sales for the last 10 years, what are the projected inventories for 2016 ? (Round to the nearest dollar.) Using the average of the percent of sales for the last 10 years, what are the projected inventories for 2017 ? \& (Round to the nearest dollar.) Using the average of the percent of sales for the last 10 years, what are the projected inventories for 2018 ? (Round to the nearest dollar.)
Step by Step Solution
There are 3 Steps involved in it

Get step-by-step solutions from verified subject matter experts