

Question: Data table McDonough Products, Inc. Balance Sheet Compared with Industry Average December 31, 2021 Current assets Plant assets, net Intangible assets, net Other assets
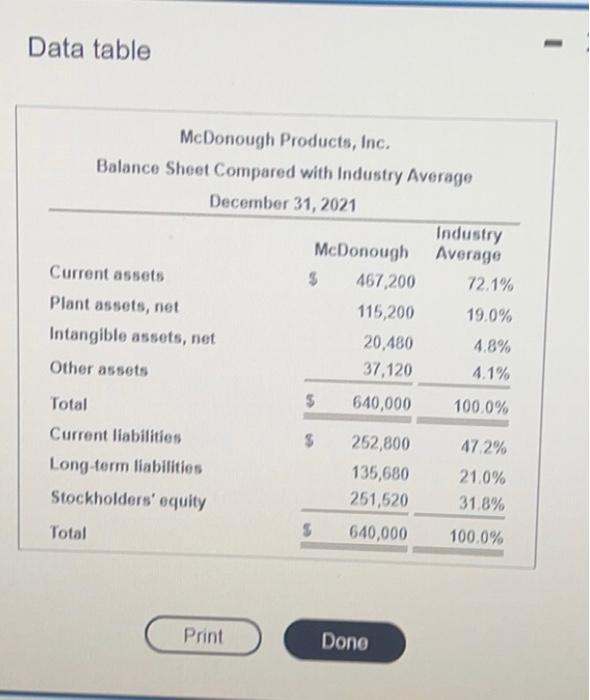
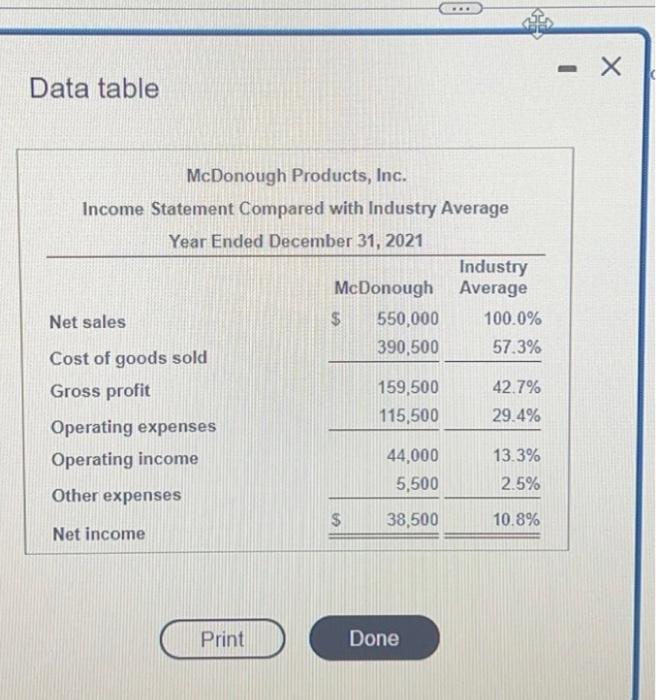
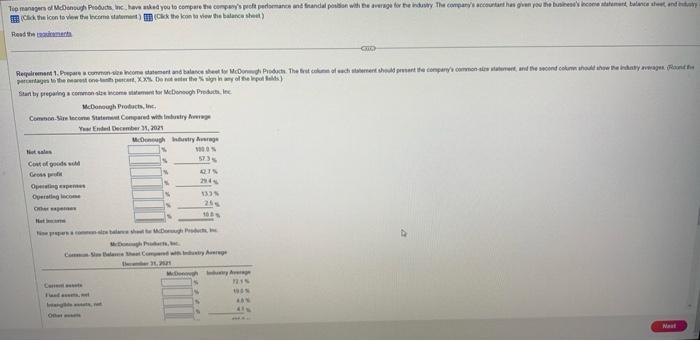
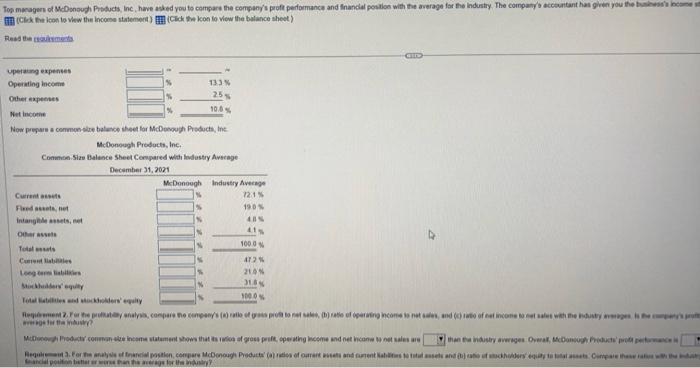
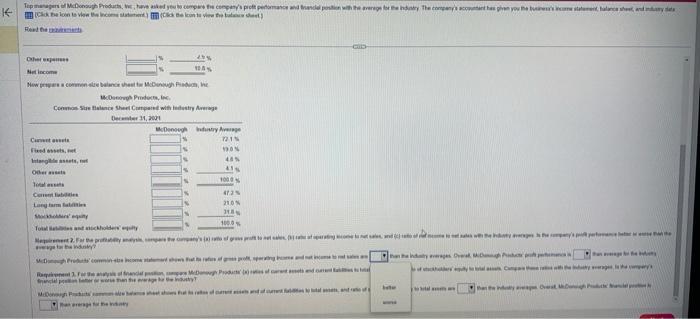
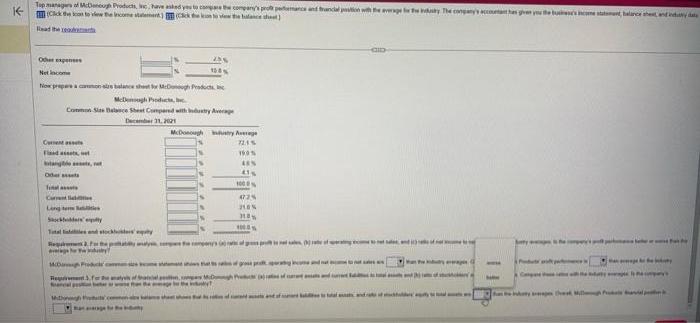
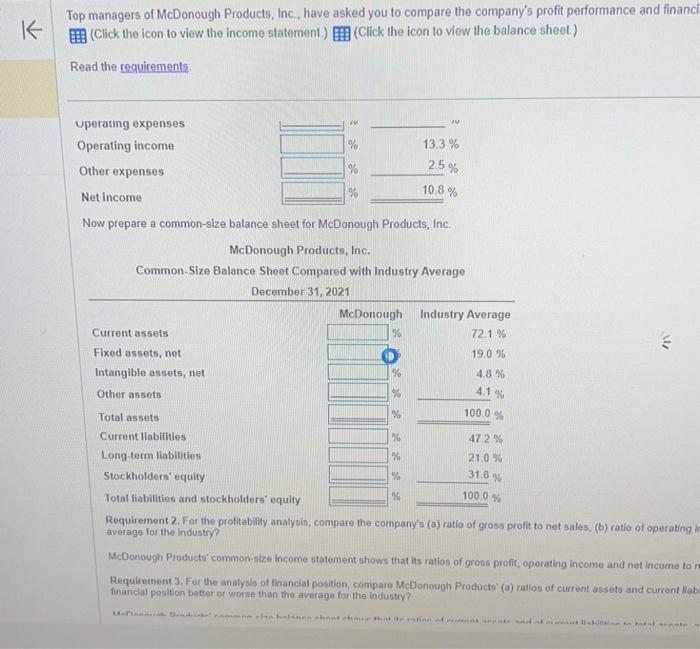
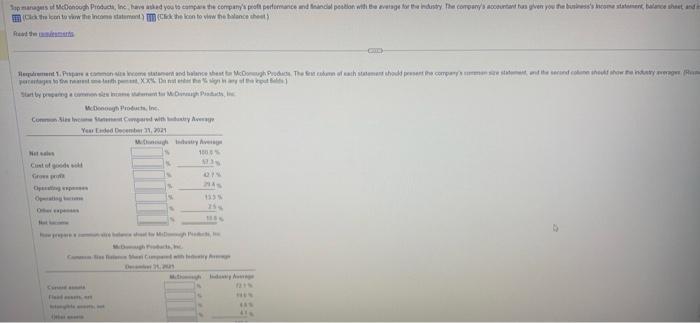
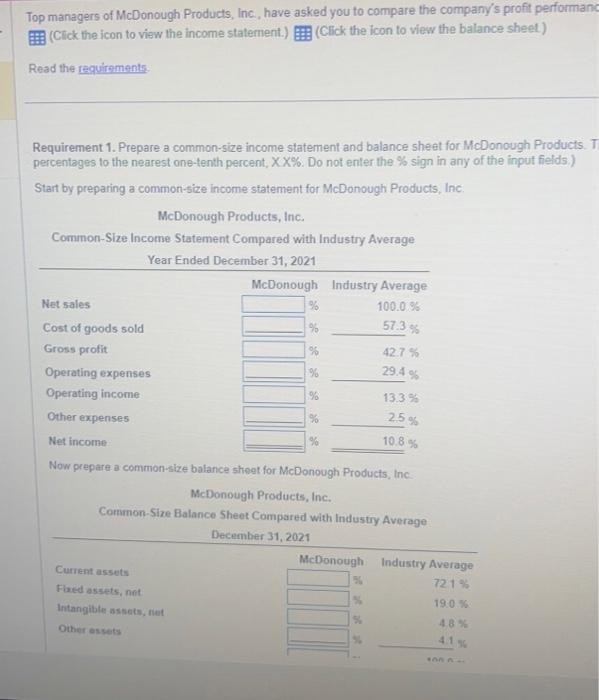
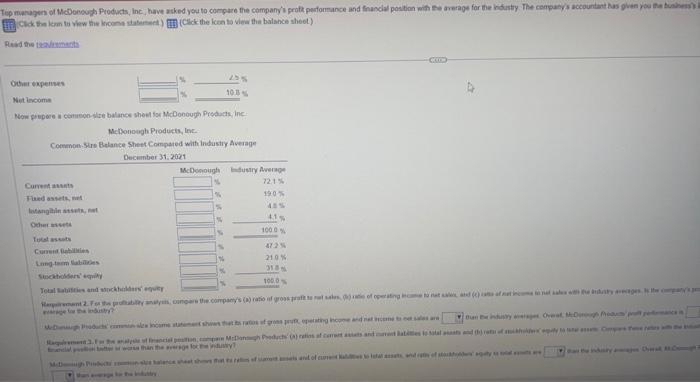
Data table McDonough Products, Inc. Balance Sheet Compared with Industry Average December 31, 2021 Current assets Plant assets, net Intangible assets, net Other assets Total Current liabilities Long-term liabilities Stockholders' equity Total Print McDonough 467,200 115,200 20,480 37,120 640,000 $ S 252,800 135,680 251,520 S 640,000 Done Industry Average 72.1% 19.0% 4.8% 4.1% 100.0% 47.2% 21.0% 31.8% 100.0% Data table McDonough Products, Inc. Income Statement Compared with Industry Average Year Ended December 31, 2021 Net sales Cost of goods sold Gross profit Operating expenses Operating income Other expenses Net income Print McDonough 550,000 390,500 $ 159,500 115,500 44,000 5,500 $ 38,500 Done Industry Average 100.0% 57.3% 42.7% 29.4% 13.3% 2.5% 10.8% - X Tip managers of McDonough Products, Inc. have asked you to compare the company's profit performance and finandal position with the average for the industry. The company's accountant has given you the business's income statement, balance sheet, and try (Click the icon to view the income statement)(Click the icon to view the balance sheet) Read the meta Requirement 1. Prepare a common-size income statement and balance sheet for McDongh Products. The first column of each statement should present the company's common slow statement, and the second column should show the industry averages de percentages to the nearest one-tenth percent, XX%. Do not enter the % sign in any of the Inpol Balds) Start by preparing a common se income statement for McDonough Products, inc McDonough Products, Inc. Common Sire tecome Statement Compared with Industry Average Year Ended December 31, 2021 Not sales Cost of goods sold Gross profi Operating expenses C Other p Net Nie propers comme le balare shatte Mosh Produc O McDonough industry Average 100.0 % 57.3% 427% 294% 133% 25% 100% ge McDough Ph Co Ble heat Compared with Industry Arge 31,252 McDough y 723% WAN ARN Nest Top managers of McDonough Products, Inc, have asked you to compare the company's proft performance and financial position with the average for the industry. The company's accountant has given you the business's income (Click the icon to view the income statement) (Click the icon to view the balance sheet) Read the auksments uperaung expenses Operating income Other expenses Net Income Now prepare a common-size balance sheet for McDonough Products, inc McDonough Products, Inc. Common Size Balance Sheet Compared with Industry Average December 31, 2021 Current assets Fixed assets, not Intangible assets, net Other asse Total assets Current libe Long term liabilities 13.3 % 25% 10.0% Stockholders' equity Total abilities and stockholders' equity McDonough Industry Average 72:1 % 190% 40% 41% 100.0% 47.2% 21.0% 31.4% 100.0% Reqment 2. For the profitaty analysis, compare the company's (a) ratio of grass profit to net sales, (b) ratio of operating income to net sales, and (c) ratio of net income to net sales with the industry averages is the company's prof wage for the industry? McDonough Products common size income statement shows that its ratios of gross proft, operating income and net income to net sales are than the industry averages Overal, McDonough Products prot permane Requirement. For the analysis of financial position, compare McDonough Products (a) ratios of oumant assets and current abilities to total assets and (b) ratio of stockholders equity to total assets Compare these rain with the n nancial position batter or worse than the average for the industry Top managers of McDonough Products, wc, have asked you to compare the company's proft performance and financial position with the average for the industry. The company's accountant has given you the busines's come statement balance sheet and y (Click the loon to view the income statemen) (Cck the icon to view the lat Other expe Net Income Now per a common size balance sheet for McD McDonough Products, Inc. Common Sealance Sheet Compared with industry Average December 31, 201 C Fixed assets, Intangible assets, Other Total Corrent bi w 547 McDonough industry Average 7215 990% 48% fo N NIY 100% Long term f Moky Total Bates and stockholders ty 2. For the profatty anys, par the company's (a) rato of gres proft to net sales ( aparating come to not sales and age for the indu McDough Produs' commin etre come star shows to rates of gres proft, spring 47.25 21.0% Naxc 100.0 Requint3 of financial son mp McDonough Products (es of care asts and one of nancial pen letter worse than the everage the industy McDoh Ps o pursue aur ja vegi va ung time na mama mz and of totale wtedyages the company's portance bette than the inday everages Overal Minh P of hersely to al Campath * po opes (7) bete the tyresys that the indely average Over MP Top managers of McDonough Products, inc. have asked yes to compare the company's prot pemance and trancial position with the average for the industry. The company's accountant has given you the busines's income statement, balance sheat, and industry da K- Click the loan to view the income stat) (k w the balance that) Other expenses Net Income Now prepare a common se balance sheet for McDonough Products McDough Products, c Common S Balance Sheet Compared with industry Average December 31, 2021 C Flad assets, t ang, Oder final C Long Sty Totals and stock y Requiremen g MD ww Fred encal pe b Moh ge McDonough ustry Average 72.4% 150% AES patywy, on 90 ty of al 100% 0725 210% HEW 1000 p Preu ( Fo Mw P Compare y Mill K Top managers of McDonough Products, Inc., have asked you to compare the company's profit performance and financi (Click the icon to view the income statement.) (Click the icon to view the balance sheet.) Read the requirements. Operating expenses Operating income Other expenses Net income. Current assets Fixed assets, net Intangible assets, net Other assets Total assets Current liabilities Long-term liabilities Now prepare a common-size balance sheet for McDonough Products, Inc. McDonough Products, Inc. Common-Size Balance Sheet Compared with Industry Average December 31, 2021 McDonough % % 79 % % % % % 13.3% 2.5% 10.8 % Industry Average 72.1% 19.0 % 4.8% 4.1% 100.0 % 47.2 % 21.0% 31.8% 100.0 % 3 Stockholders' equity Total liabilities and stockholders' equity Requirement 2. For the profitability analysis, compare the company's (a) ratio of gross profit to net sales, (b) ratio of operating in average for the industry? McDonough Products' common-size income statement shows that its ratios of gross profit, operating income and net income to re Requirement 3. For the analysis of financial position, compare McDonough Products' (a) ratios of current assets and current llaba financial position better or worse than the average for the industry? M-Dan Dammen en balanne hont che hatte eine afstand of tablete Sop managers of McDonough Products, Inc, have asked you to compare the company's proft performance and financial position with the everage for the industry. The company's accountant has given you the business's income statement, balance sheet and in (Click the icon to view the income statement) (Click the icon to view the balance sheet) Read the smart Requirement 1. Prepare a common size income statement and balance sheat to McDough Products. The Sest column of each statement should present the company's man sie statement, and the second coline should show the industry everages (Rom percentages to the nearest une tenth pamet, XX% De naten he sign in any of the put d Start by preparing a common size income tant for McDonagh Padach, Inc McDonough Products, Inc. Common Sie e Statement Compared with edustry Average Year Ended December 31, 2021 Mugh Not al Cost of goods sold Grow prof Opening Oer expe Fid bello Me McDgh Products, CM N Dec ustry Average 100% MAN 07% 133% 25% MIN Comedy 25, 201 Indy BIN (AS 41% Top managers of McDonough Products, Inc., have asked you to compare the company's profit performanc (Click the icon to view the income statement.) (Click the icon to view the balance sheet) Read the requirements. Requirement 1. Prepare a common-size income statement and balance sheet for McDonough Products. T percentages to the nearest one-tenth percent, XX%. Do not enter the % sign in any of the input fields.) Start by preparing a common-size income statement for McDonough Products, Inc. McDonough Products, Inc. Common-Size Income Statement Compared with Industry Average Year Ended December 31, 2021 McDonough Net sales Cost of goods sold Gross profit Operating expenses Operating income Other expenses % % % % Current assets Fixed assets, net Intangible assets, fiet Other assets Industry Average 100.0 % 57.3% Net income Now prepare a common-size balance sheet for McDonough Products, Inc. McDonough Products, Inc. Common-Size Balance Sheet Compared with Industry Average December 31, 2021 42.7% 29.4% 13.3% 2.5% 10.8% McDonough Industry Average 721% 19.0 % % 4.8% 1556 Top managers of McDonough Products, Inc., have asked you to compare the company's profit performance and financial position with the average for the industry. The company's accountant has given you the business's i Click the loan to view the income statement) (Click the icon to view the balance sheet). Read the menta Other expenses Net Income Now prepare a common-size balance sheet for McDonough Products, Inc. 25% McDonough Products, Inc. Common Sirs Balance Sheet Compared with Industry Average December 31, 2021 Current assets Fixed assets, net Intangible assets, Other st Total assots Current Bebilities McDonough Industry Average 72,1% 190% 45% 41% 100.0% 47.2% 21.0% 31.8% 100.0% Stockholders' equity Total abilities and stockholders equity Harremant 2. For the profitability analysis, compare the company's (a) ratio of gross praft to al sales, erage for the industry? MD COD cate of operating income t Produche income statement shows that is ratios of grons prut, operating income and not come toe Ragement 2. For the analyse of facial pon comp McDongh Products (A) ralios of current assets and ment Babies to total asts and the rear of the tyto tempeste altterworse than the average for the vidusly? Ban
Step by Step Solution
3.32 Rating (143 Votes )
There are 3 Steps involved in it
Answer 1 McDonough products inc Common size Income Statement For Years Ended December 312016 Sales C... View full answer

Get step-by-step solutions from verified subject matter experts