

Question: Data Table Sample Size, n Mean Factor, A2 Upper Range, Lower Range, D4 D3 2 1.880 3.268 0 3 1.023 2.574 4 0.729 2.282
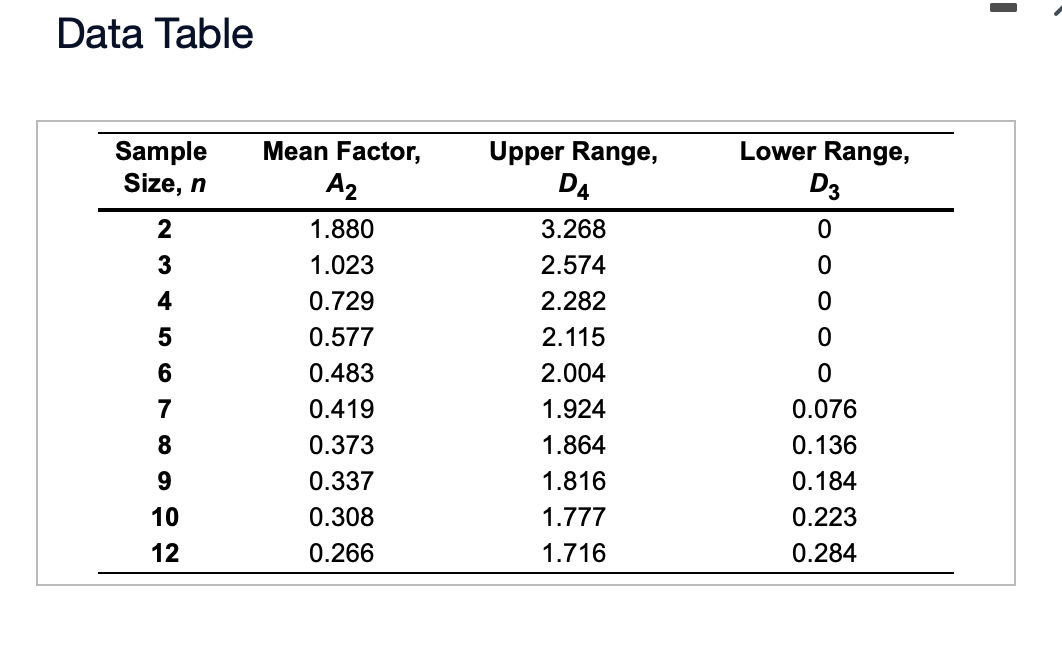
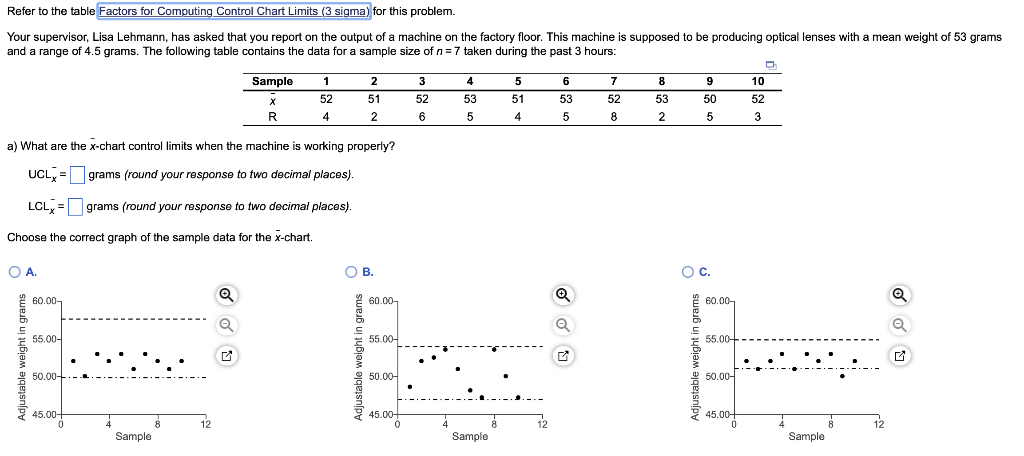
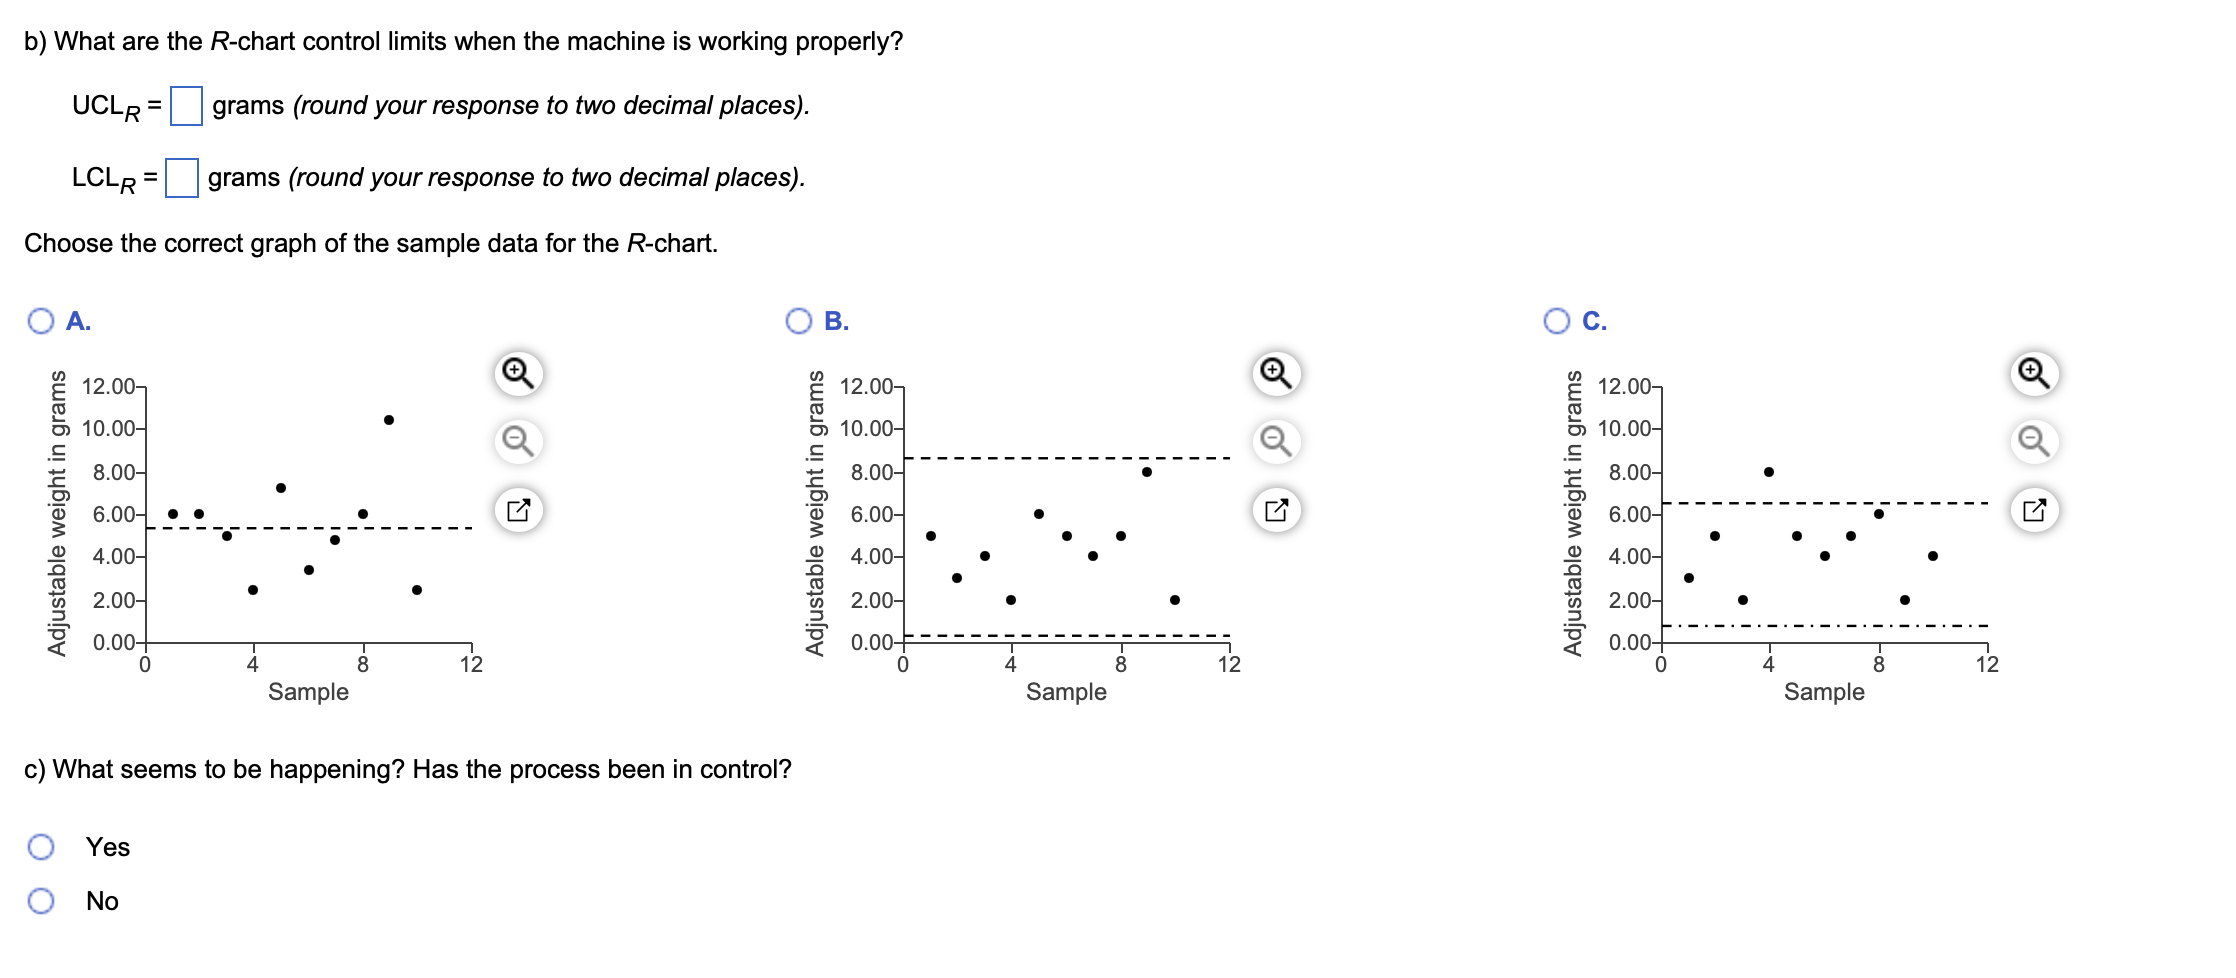
Data Table Sample Size, n Mean Factor, A2 Upper Range, Lower Range, D4 D3 2 1.880 3.268 0 3 1.023 2.574 4 0.729 2.282 0 5 0.577 2.115 0 6 0.483 2.004 0 7 0.419 1.924 0.076 8 0.373 1.864 0.136 9 0.337 1.816 0.184 10 0.308 1.777 0.223 12 0.266 1.716 0.284 Refer to the table Factors for Computing Control Chart Limits (3 sigma) for this problem. Your supervisor, Lisa Lehmann, has asked that you report on the output of a machine on the factory floor. This machine is supposed to be producing optical lenses with a mean weight of 53 grams and a range of 4.5 grams. The following table contains the data for a sample size of n = 7 taken during the past 3 hours: Sample 1 2 3 4 5 6 7 8 9 10 x 52 51 52 53 51 53 52 53 50 52 R 4 2 6 5 4 5 8 2 5 3 a) What are the x-chart control limits when the machine is working properly? UCLX = grams (round your response to two decimal places). LCLX = grams (round your response to two decimal places). Choose the correct graph of the sample data for the x-chart. A. 60.00- Adjustable weight in grams 55.00- 50.00 B. 60.00- 55.00- 50.00- C. 60.00 55.00 50.00 45.00+ 45.00 12 45.00- 0 12 Sample Sample Sample b) What are the R-chart control limits when the machine is working properly? UCLR = grams (round your response to two decimal places). = grams (round your response to two decimal places). LCLR Choose the correct graph of the sample data for the R-chart. A. 12.00- 10.00- 8.00- 6.00- 4.00- 2.00- 0.00- 8 12 Sample c) What seems to be happening? Has the process been in control? Yes No B. 12.00- 12.00- 10.00- 10.00- 8.00- 8.00- 6.00- 6.00- 4.00- 4.00- 2.00- 2.00- 0.00 0.00- 0 12 0 12 Sample Sample
Step by Step Solution
There are 3 Steps involved in it
To solve the problem we need to calculate the control limits for both the x x chart and the Rchart u... View full answer

Get step-by-step solutions from verified subject matter experts