

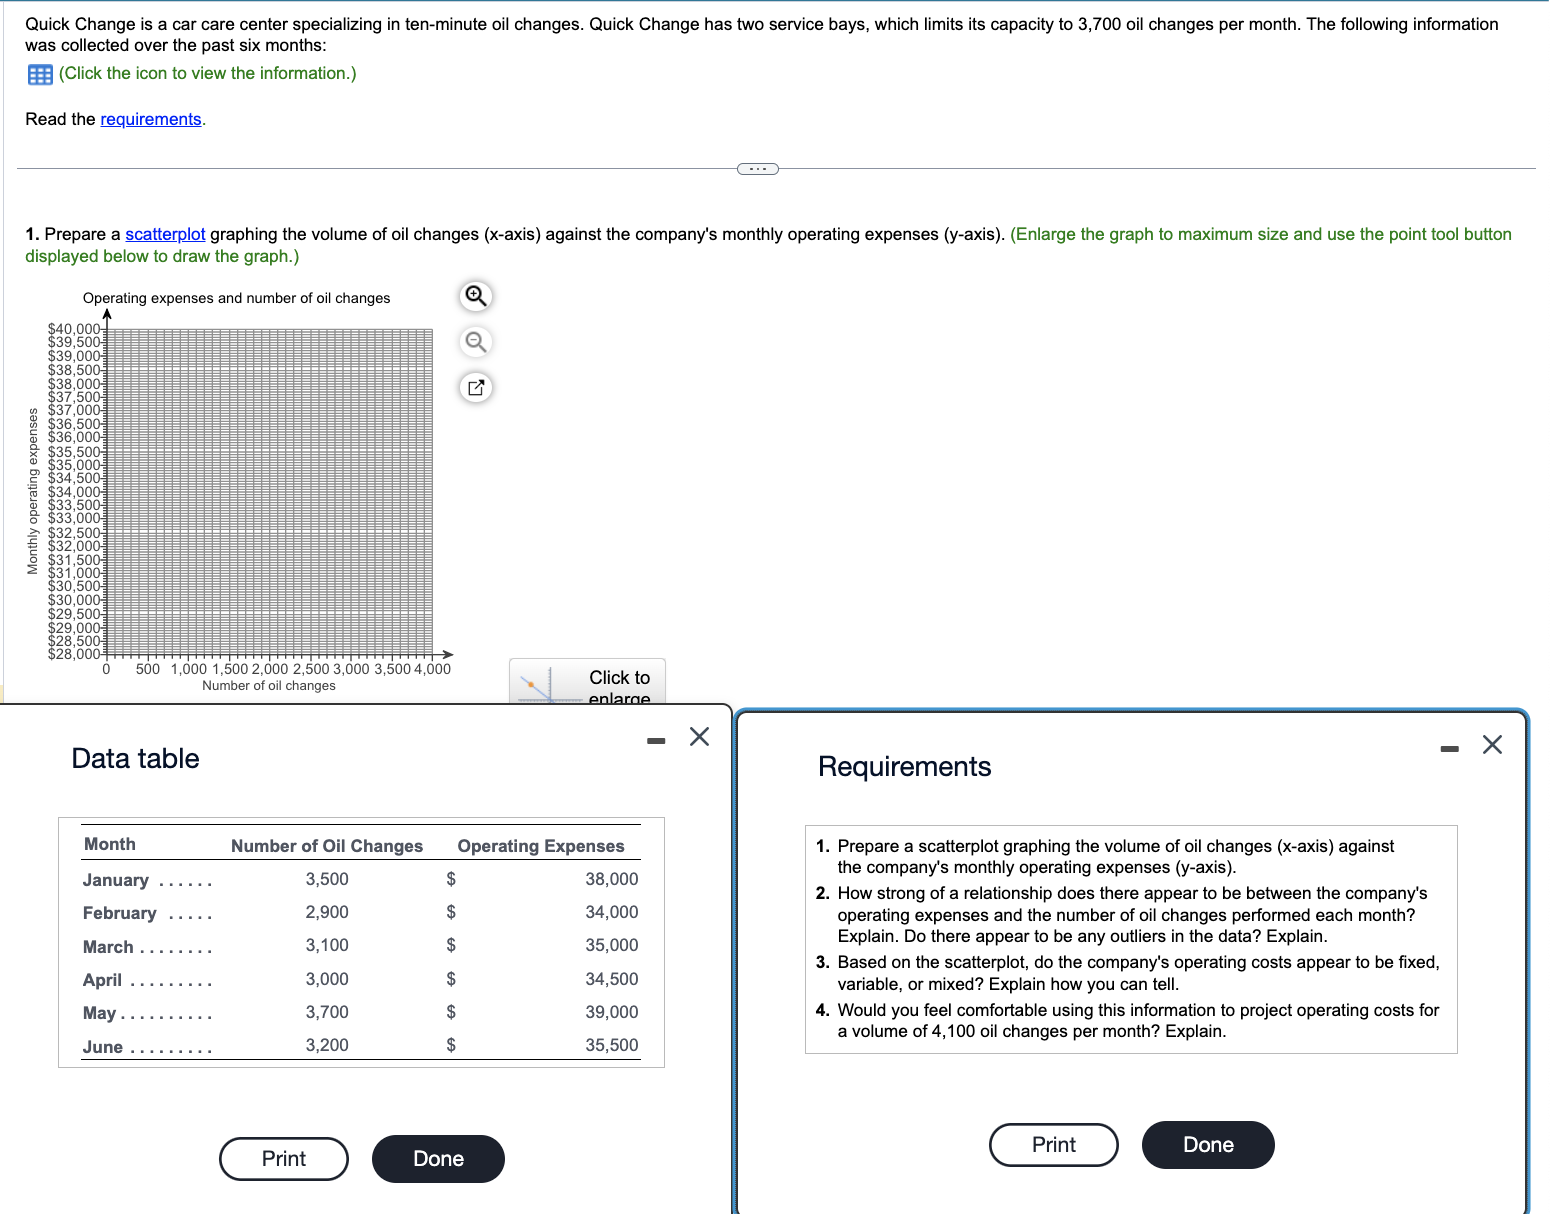
Question: Data table Requirements Prepare a scatterplot graphing the volume of oil changes ( x - axis ) against the company's monthly operating expenses ( y
Data table
Requirements
Prepare a scatterplot graphing the volume of oil changes xaxis against
the company's monthly operating expenses yaxis
How strong of a relationship does there appear to be between the company's
operating expenses and the number of oil changes performed each month?
Explain. Do there appear to be any outliers in the data? Explain.
Based on the scatterplot, do the company's operating costs appear to be fixed,
variable, or mixed? Explain how you can tell.
Would you feel comfortable using this information to project operating costs for
a volume of oil changes per month? Explain.
Step by Step Solution
There are 3 Steps involved in it
1 Expert Approved Answer
Step: 1 Unlock

Question Has Been Solved by an Expert!
Get step-by-step solutions from verified subject matter experts
Step: 2 Unlock
Step: 3 Unlock