

Question: DATA TABLE: Sample (week) Late Flights Sample (week) Late Flights 1 5 16 2 2 3 17 5 3 12 18 10 4 2 19
DATA TABLE:
| Sample (week) | Late Flights | Sample (week) | Late Flights |
| 1 | 5 | 16 | 2 |
| 2 | 3 | 17 | 5 |
| 3 | 12 | 18 | 10 |
| 4 | 2 | 19 | 3 |
| 5 | 3 | 20 | 2 |
| 6 | 2 | 21 | 4 |
| 7 | 12 | 22 | 24 |
| 8 | 6 | 23 | 4 |
| 9 | 10 | 24 | 3 |
| 10 | 0 | 25 | 3 |
| 11 | 4 | 26 | 1 |
| 12 | 3 | 27 | 0 |
| 13 | 5 | 28 | 1 |
| 14 | 3 | 29 | 3 |
| 15 | 8 | 30 | 7 |
PLEASE SHOW ME HOW YOU'RE ANSWERING! MY CALCULATIONS ARE OFF AND I CANT FIGURE OUT WHY. Thank you!!
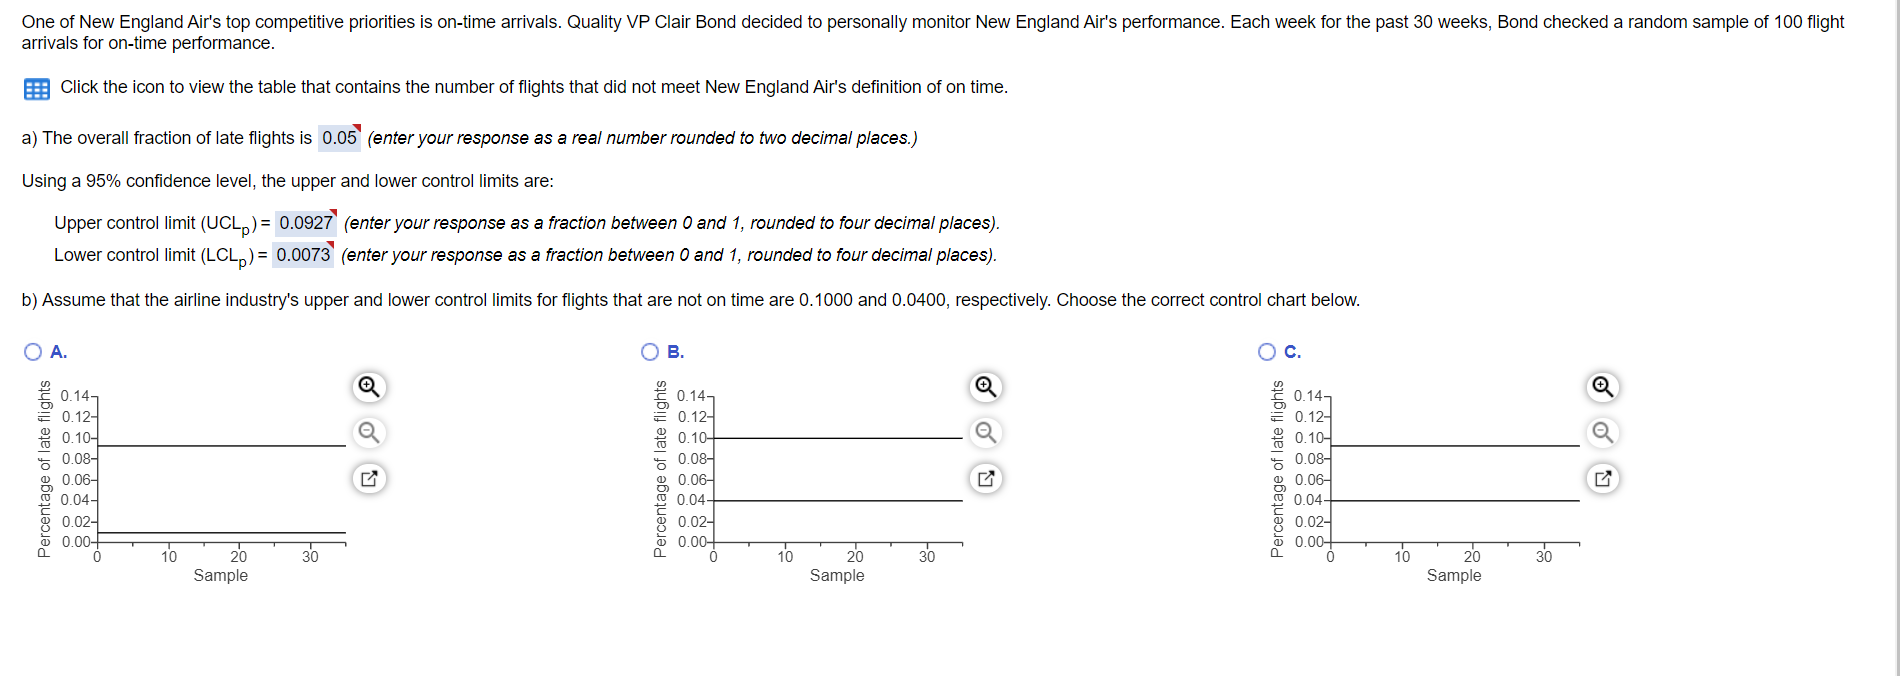
One of New England Air's top competitive priorities is on-time arrivals. Quality VP Clair Bond decided to personally monitor New England Air's performance. Each week for the past 30 weeks, Bond checked a random sample of 100 flight arrivals for on-time performance. Click the icon to view the table that contains the number of flights that did not meet New England Air's definition of on time. a) The overall fraction of late flights is 0.05 (enter your response as a real number rounded to two decimal places.) Using a 95% confidence level, the upper and lower control limits are: Upper control limit (UCLA) = 0.0927 (enter your response as a fraction between 0 and 1, rounded to four decimal places). Lower control limit (LCLP) = 0.0073 (enter your response as a fraction between 0 and 1, rounded to four decimal places). b) Assume that the airline industry's upper and lower control limits for flights that are not on time are 0.1000 and 0.0400, respectively. Choose the correct control chart below. A. . Oc. Percentage of late flights 0.14 0.12- 0.10- 0.08 0.06- 0.04- 0.02- 0.00+ Percentage of late flights 0.14 0.12 0.10 0.08- 0.06 0.04- 0.02- 0.00 Percentage of late flights 0.14 0.12 0.10- 50.084 0.06- 0.04- 0.02- 0.004 10 30 11 10 30 10 30 20 Sample 20 Sample 20 SampleStep by Step Solution
There are 3 Steps involved in it
1 Expert Approved Answer
Step: 1 Unlock

Question Has Been Solved by an Expert!
Get step-by-step solutions from verified subject matter experts
Step: 2 Unlock
Step: 3 Unlock