

Question: Data Table - X Mariner Corporation Income Statement For the Years Ended December 31, 2017 and 2016 (amounts in thousands) 2017 2016 Sales revenues 426,411
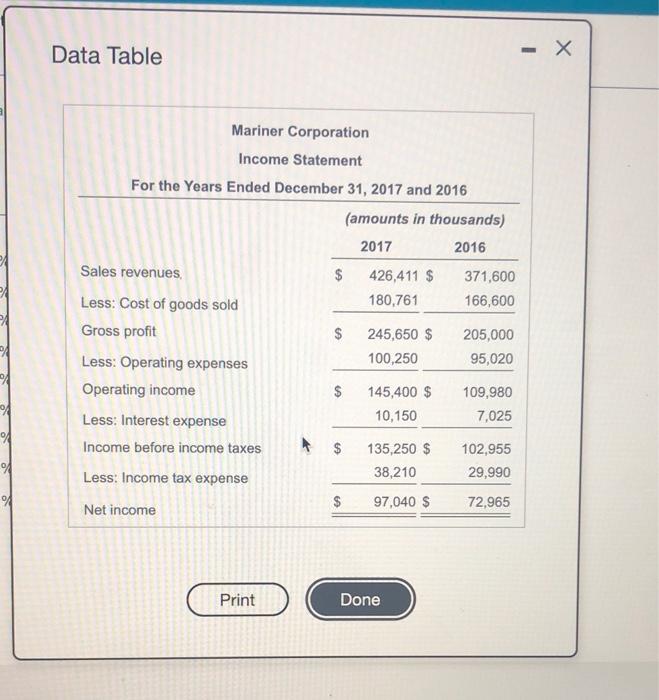
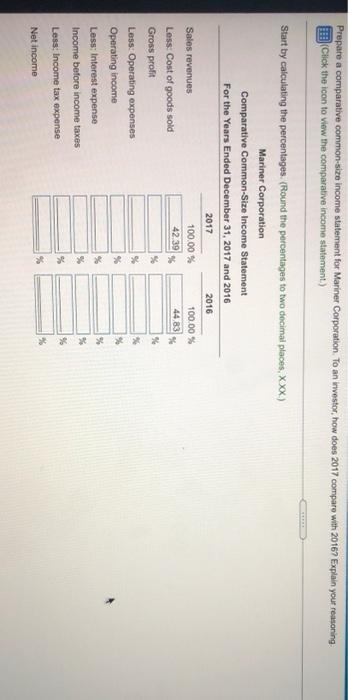
Data Table - X Mariner Corporation Income Statement For the Years Ended December 31, 2017 and 2016 (amounts in thousands) 2017 2016 Sales revenues 426,411 $ 371,600 Less: Cost of goods sold 180,761 166,600 Gross profit $ 245,650 $ 205,000 Less: Operating expenses 100,250 95,020 Operating income $ 145,400 $ 109,980 Less: Interest expense 10,150 7,025 Income before income taxes $ 135,250 $ 102,955 Less: Income tax expense 38,210 29,990 $ 97,040 $ 72,965 Net income A of Print Done Prepare a comparative common-size income statement for Mariner Corporation. To an investor, how does 2017 compare with 2016? Explain your reasoning Click the icon to view the comparative income statement) Start by calculating the percentages. (Round the percentages to two decimal places, XXX) Mariner Corporation Comparative Common-Size Income Statement For the Years Ended December 31, 2017 and 2016 2017 2016 100.00 % 42.39 100,00 % 44.83 Sales revenues Less Cost of goods sold Gross profit Less: Operating expenses Operating income Less: Interest expense Income before income taxes RRR % % Less Income tax expense % % Net income
Step by Step Solution
There are 3 Steps involved in it

Get step-by-step solutions from verified subject matter experts