

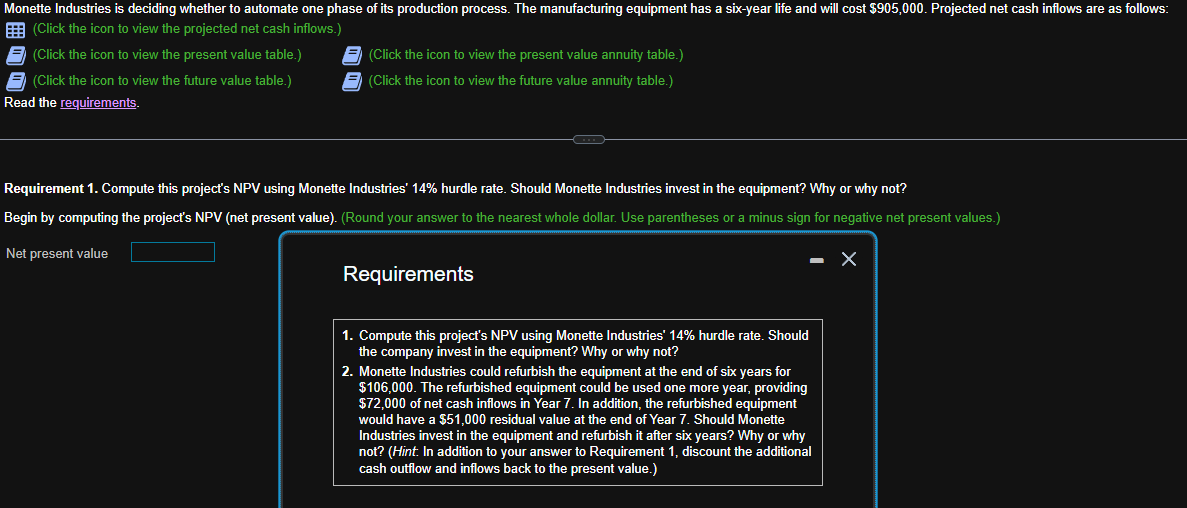
Question: Data Table Year 1.... $260,000 Year 2.... $250,000 Year 3.... $223,000 Year 4.... $211,000 Year 5.... $204,000 Year 6.... $178,000 (Click the icon to view
 Data Table
Year 1.... $260,000
Year 2.... $250,000
Year 3.... $223,000
Year 4.... $211,000
Year 5.... $204,000
Year 6.... $178,000
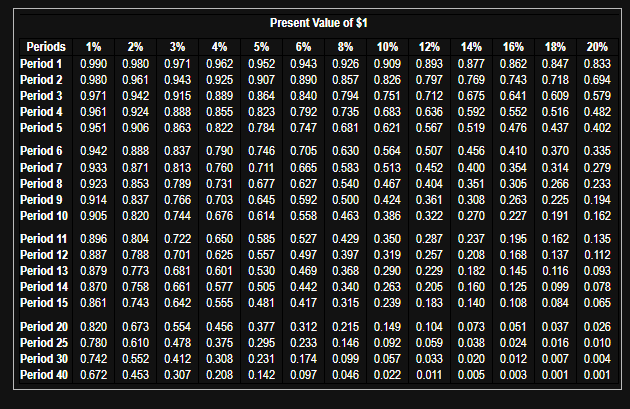
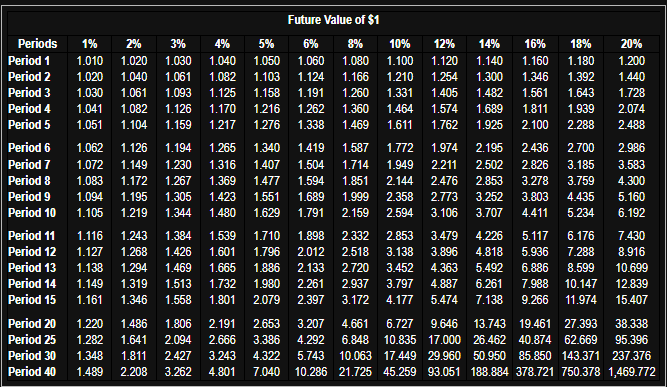
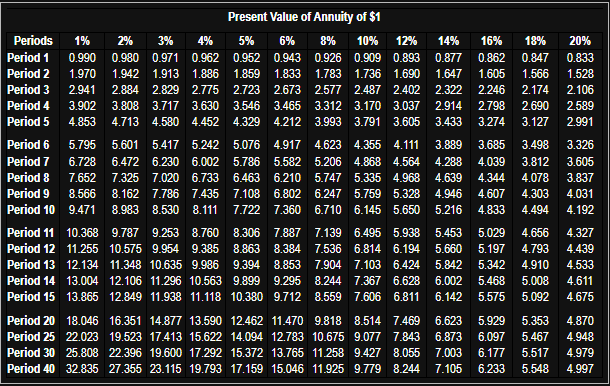
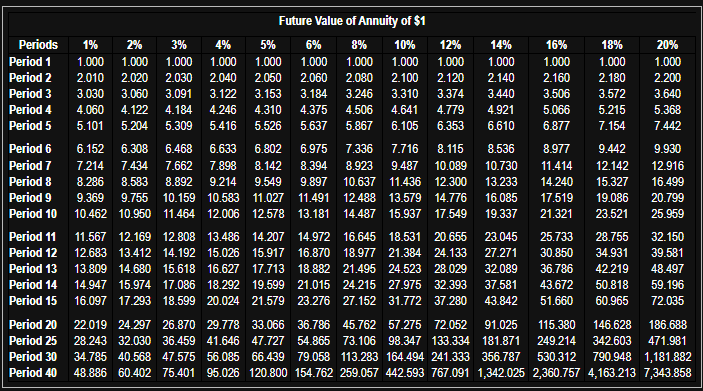
(Click the icon to view the projected net cash inflows.) (Click the icon to view the present value table.) = (Click the icon to view the present value annuity table.) (Click the icon to view the future value table.) (Click the icon to view the future value annuity table.) Read the requirements. Requirement 1. Compute this project's NPV using Monette Industries' 14% hurdle rate. Should Monette Industries invest in the equipment? Why or why not? \begin{tabular}{|l|c|c|c|c|c|c|c|c|c|c|c|c|c|c|} \hline & & & & & & & & & \\ \hline Periods & 1% & 2% & 3% & 4% & 5% & 6% & 8% & 10% & 12% & 14% & 16% & 18% & 20% \\ \hline Period 1 & 0.990 & 0.980 & 0.971 & 0.962 & 0.952 & 0.943 & 0.926 & 0.909 & 0.893 & 0.877 & 0.862 & 0.847 & 0.833 \\ Period 2 & 0.980 & 0.961 & 0.943 & 0.925 & 0.907 & 0.890 & 0.857 & 0.826 & 0.797 & 0.769 & 0.743 & 0.718 & 0.694 \\ Period 3 & 0.971 & 0.942 & 0.915 & 0.889 & 0.864 & 0.840 & 0.794 & 0.751 & 0.712 & 0.675 & 0.641 & 0.609 & 0.579 \\ Period 4 & 0.961 & 0.924 & 0.888 & 0.855 & 0.823 & 0.792 & 0.735 & 0.683 & 0.636 & 0.592 & 0.552 & 0.516 & 0.482 \\ Period 5 & 0.951 & 0.906 & 0.863 & 0.822 & 0.784 & 0.747 & 0.681 & 0.621 & 0.567 & 0.519 & 0.476 & 0.437 & 0.402 \\ Period 6 & 0.942 & 0.888 & 0.837 & 0.790 & 0.746 & 0.705 & 0.630 & 0.564 & 0.507 & 0.456 & 0.410 & 0.370 & 0.335 \\ Period 7 & 0.933 & 0.871 & 0.813 & 0.760 & 0.711 & 0.665 & 0.583 & 0.513 & 0.452 & 0.400 & 0.354 & 0.314 & 0.279 \\ Period 8 & 0.923 & 0.853 & 0.789 & 0.731 & 0.677 & 0.627 & 0.540 & 0.467 & 0.404 & 0.351 & 0.305 & 0.266 & 0.233 \\ Period 9 & 0.914 & 0.837 & 0.766 & 0.703 & 0.645 & 0.592 & 0.500 & 0.424 & 0.361 & 0.308 & 0.263 & 0.225 & 0.194 \\ Period 10 & 0.905 & 0.820 & 0.744 & 0.676 & 0.614 & 0.558 & 0.463 & 0.386 & 0.322 & 0.270 & 0.227 & 0.191 & 0.162 \\ Period 11 & 0.896 & 0.804 & 0.722 & 0.650 & 0.585 & 0.527 & 0.429 & 0.350 & 0.287 & 0.237 & 0.195 & 0.162 & 0.135 \\ Period 12 & 0.887 & 0.788 & 0.701 & 0.625 & 0.557 & 0.497 & 0.397 & 0.319 & 0.257 & 0.208 & 0.168 & 0.137 & 0.112 \\ Period 13 & 0.879 & 0.773 & 0.681 & 0.601 & 0.530 & 0.469 & 0.368 & 0.290 & 0.229 & 0.182 & 0.145 & 0.116 & 0.093 \\ Period 14 & 0.870 & 0.758 & 0.661 & 0.577 & 0.505 & 0.442 & 0.340 & 0.263 & 0.205 & 0.160 & 0.125 & 0.099 & 0.078 \\ Period 15 & 0.861 & 0.743 & 0.642 & 0.555 & 0.481 & 0.417 & 0.315 & 0.239 & 0.183 & 0.140 & 0.108 & 0.084 & 0.065 \\ Period 20 & 0.820 & 0.673 & 0.554 \end{tabular} \begin{tabular}{|l|c|c|c|c|c|c|c|c|c|c|c|c|c|} \hline & & \multicolumn{10}{|c|}{} & \multicolumn{10}{|l|}{ Future Value of \$1 } \\ \hline Periods & 1% & 2% & 3% & 4% & 5% & 6% & 8% & 10% & 12% & 14% & 16% & 18% & 20% \\ \hline Period 1 & 1.010 & 1.020 & 1.030 & 1.040 & 1.050 & 1.060 & 1.080 & 1.100 & 1.120 & 1.140 & 1.160 & 1.180 & 1.200 \\ Period 2 & 1.020 & 1.040 & 1.061 & 1.082 & 1.103 & 1.124 & 1.166 & 1.210 & 1.254 & 1.300 & 1.346 & 1.392 & 1.440 \\ Period 3 & 1.030 & 1.061 & 1.093 & 1.125 & 1.158 & 1.191 & 1.260 & 1.331 & 1.405 & 1.482 & 1.561 & 1.643 & 1.728 \\ Period 4 & 1.041 & 1.082 & 1.126 & 1.170 & 1.216 & 1.262 & 1.360 & 1.464 & 1.574 & 1.689 & 1.811 & 1.939 & 2.074 \\ Period 5 & 1.051 & 1.104 & 1.159 & 1.217 & 1.276 & 1.338 & 1.469 & 1.611 & 1.762 & 1.925 & 2.100 & 2.288 & 2.488 \\ \hline Period 6 & 1.062 & 1.126 & 1.194 & 1.265 & 1.340 & 1.419 & 1.587 & 1.772 & 1.974 & 2.195 & 2.436 & 2.700 & 2.986 \\ Period 7 & 1.072 & 1.149 & 1.230 & 1.316 & 1.407 & 1.504 & 1.714 & 1.949 & 2.211 & 2.502 & 2.826 & 3.185 & 3.583 \\ Period 8 & 1.083 & 1.172 & 1.267 & 1.369 & 1.477 & 1.594 & 1.851 & 2.144 & 2.476 & 2.853 & 3.278 & 3.759 & 4.300 \\ Period 9 & 1.094 & 1.195 & 1.305 & 1.423 & 1.551 & 1.689 & 1.999 & 2.358 & 2.773 & 3.252 & 3.803 & 4.435 & 5.160 \\ Period 10 & 1.105 & 1.219 & 1.344 & 1.480 & 1.629 & 1.791 & 2.159 & 2.594 & 3.106 & 3.707 & 4.411 & 5.234 & 6.192 \\ \hline Period 11 & 1.116 & 1.243 & 1.384 & 1.539 & 1.710 & 1.898 & 2.332 & 2.853 & 3.479 & 4.226 & 5.117 & 6.176 & 7.430 \\ Period 12 & 1.127 & 1.268 & 1.426 & 1.601 & 1.796 & 2.012 & 2.518 & 3.138 & 3.896 & 4.818 & 5.936 & 7.288 & 8.916 \\ Period 13 & 1.138 & 1.294 & 1.469 & 1.665 & 1.886 & 2.133 & 2.720 & 3.452 & 4.363 & 5.492 & 6.886 & 8.599 & 10.699 \\ Period 14 & 1.149 & 1.319 & 1.513 & 1.732 & 1.980 & 2.261 & 2.937 & 3.797 & 4.887 & 6.261 & 7.988 & 10.147 & 12.839 \\ Period 15 & 1.161 & 1.346 & 1.558 & 1.801 & 2.079 & 2.397 & 3.172 & 4.177 & 5.474 & 7.138 & 9.266 & 11.974 & 15.407 \\ Perio \end{tabular} \begin{tabular}{|c|c|c|c|c|c|c|c|c|c|c|c|c|c|} \hline \multicolumn{10}{|l|}{} & \multicolumn{10}{|c|}{ Present Value of Annuity of \$1 } & & & \\ \hline Periods & 1% & 2% & 3% & 4% & 5% & 6% & 8% & 10% & 12% & 14% & 16% & 18% & 20% \\ \hline Period 1 & 0.990 & 0.980 & 0.971 & 0.962 & 0.952 & 0.943 & 0.926 & 0.909 & 0.893 & 0.877 & 0.862 & 0.847 & 0.833 \\ Period 2 & 1.970 & 1.942 & 1.913 & 1.886 & 1.859 & 1.833 & 1.783 & 1.736 & 1.690 & 1.647 & 1.605 & 1.566 & 1.528 \\ Period 3 & 2.941 & 2.884 & 2.829 & 2.775 & 2.723 & 2.673 & 2.577 & 2.487 & 2.402 & 2.322 & 2.246 & 2.174 & 2.106 \\ Period 4 & 3.902 & 3.808 & 3.717 & 3.630 & 3.546 & 3.465 & 3.312 & 3.170 & 3.037 & 2.914 & 2.798 & 2.690 & 2.589 \\ Period 5 & 4.853 & 4.713 & 4.580 & 4.452 & 4.329 & 4.212 & 3.993 & 3.791 & 3.605 & 3.433 & 3.274 & 3.127 & 2.991 \\ Period 6 & 5.795 & 5.601 & 5.417 & 5.242 & 5.076 & 4.917 & 4.623 & 4.355 & 4.111 & 3.889 & 3.685 & 3.498 & 3.326 \\ Period 7 & 6.728 & 6.472 & 6.230 & 6.002 & 5.786 & 5.582 & 5.206 & 4.868 & 4.564 & 4.288 & 4.039 & 3.812 & 3.605 \\ Period 8 & 7.652 & 7.325 & 7.020 & 6.733 & 6.463 & 6.210 & 5.747 & 5.335 & 4.968 & 4.639 & 4.344 & 4.078 & 3.837 \\ Period 9 & 8.566 & 8.162 & 7.786 & 7.435 & 7.108 & 6.802 & 6.247 & 5.759 & 5.328 & 4.946 & 4.607 & 4.303 & 4.031 \\ Period 10 & 9.471 & 8.983 & 8.530 & 8.111 & 7.722 & 7.360 & 6.710 & 6.145 & 5.650 & 5.216 & 4.833 & 4.494 & 4.192 \\ Period 11 & 10.368 & 9.787 & 9.253 & 8.760 & 8.306 & 7.887 & 7.139 & 6.495 & 5.938 & 5.453 & 5.029 & 4.656 & 4.327 \\ Period 12 & 11.255 & 10.575 & 9.954 & 9.385 & 8.863 & 8.384 & 7.536 & 6.814 & 6.194 & 5.660 & 5.197 & 4.793 & 4.439 \\ Period 13 & 12.134 & 11.348 & 10.635 & 9.986 & 9.394 & 8.853 & 7.904 & 7.103 & 6.424 & 5.842 & 5.342 & 4.910 & 4.533 \\ Period 14 & 13.004 & 12.106 & 11.296 & 10.563 & 9.899 & 9.295 & 8.244 & 7.367 & 6.628 & 6.002 & 5.468 & 5.008 & 4.611 \\ Period 15 & 13.865 & 12.849 & 11.938 & 11.118 & 10.380 & 9.712 & 8.559 & 7.6 \end{tabular} \begin{tabular}{|l|c|c|c|c|c|c|c|c|c|c|c|c|c|} \hline & & & & & \multicolumn{10}{|c|}{} & \multicolumn{1}{|l|}{ Future Value of Annuity of \$1 } \\ \hline Periods & 1% & 2% & 3% & 4% & 5% & 6% & 8% & 10% & 12% & 14% & 16% & 18% & 20% \\ \hline Period 1 & 1.000 & 1.000 & 1.000 & 1.000 & 1.000 & 1.000 & 1.000 & 1.000 & 1.000 & 1.000 & 1.000 & 1.000 & 1.000 \\ Period 2 & 2.010 & 2.020 & 2.030 & 2.040 & 2.050 & 2.060 & 2.080 & 2.100 & 2.120 & 2.140 & 2.160 & 2.180 & 2.200 \\ Period 3 & 3.030 & 3.060 & 3.091 & 3.122 & 3.153 & 3.184 & 3.246 & 3.310 & 3.374 & 3.440 & 3.506 & 3.572 & 3.640 \\ Period 4 & 4.060 & 4.122 & 4.184 & 4.246 & 4.310 & 4.375 & 4.506 & 4.641 & 4.779 & 4.921 & 5.066 & 5.215 & 5.368 \\ Period 5 & 5.101 & 5.204 & 5.309 & 5.416 & 5.526 & 5.637 & 5.867 & 6.105 & 6.353 & 6.610 & 6.877 & 7.154 & 7.442 \\ \hline Period 6 & 6.152 & 6.308 & 6.468 & 6.633 & 6.802 & 6.975 & 7.336 & 7.716 & 8.115 & 8.536 & 8.977 & 9.442 & 9.930 \\ Period 7 & 7.214 & 7.434 & 7.662 & 7.898 & 8.142 & 8.394 & 8.923 & 9.487 & 10.089 & 10.730 & 11.414 & 12.142 & 12.916 \\ Period 8 & 8.286 & 8.583 & 8.892 & 9.214 & 9.549 & 9.897 & 10.637 & 11.436 & 12.300 & 13.233 & 14.240 & 15.327 & 16.499 \\ Period 9 & 9.369 & 9.755 & 10.159 & 10.583 & 11.027 & 11.491 & 12.488 & 13.579 & 14.776 & 16.085 & 17.519 & 19.086 & 20.799 \\ Period 10 & 10.462 & 10.950 & 11.464 & 12.006 & 12.578 & 13.181 & 14.487 & 15.937 & 17.549 & 19.337 & 21.321 & 23.521 & 25.959 \\ Period 11 & 11.567 & 12.169 & 12.808 & 13.486 & 14.207 & 14.972 & 16.645 & 18.531 & 20.655 & 23.045 & 25.733 & 28.755 & 32.150 \\ Period 12 & 12.683 & 13.412 & 14.192 & 15.026 & 15.917 & 16.870 & 18.977 & 21.384 & 24.133 & 27.271 & 30.850 & 34.931 & 39.581 \\ Period 13 & 13.809 & 14.680 & 15.618 & 16.627 & 17.713 & 18.882 & 21.495 & 24.523 & 28.029 & 32.089 & 36.786 & 42.219 & 48.497 \\ Period 14 & 14.947 & 15.974 & 17.086 & 18.292 & 19.599 & 21.015 & 24.215 & 27.975 & 32.393 & 37.581 & 43.672 & 50.818 & 5 \end{tabular}
Step by Step Solution
There are 3 Steps involved in it

Get step-by-step solutions from verified subject matter experts