

Question: f) Compare the conditional distributions of the ratings for films produced in 2011 or later to those produced from 2006 to 2010. Complete the
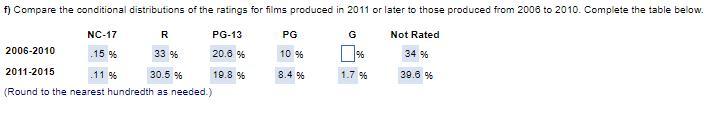
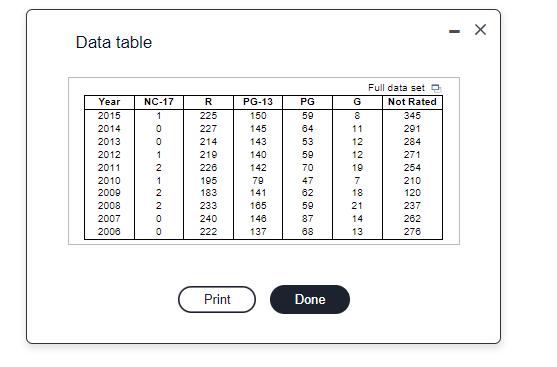
f) Compare the conditional distributions of the ratings for films produced in 2011 or later to those produced from 2006 to 2010. Complete the table below. PG-13 Not Rated NC-17 15 % 20.0 % 34 % 19.8 % 39.6 % R 33 % .11 % 30.5% (Round to the nearest hundredth as needed.) 2006-2010 2011-2015 PG 10 % 8.4 % G 96 1.7 % Data table Year 2015 2014 2013 2012 2011 2010 2009 2008 2007 2006 NC-17 1 0 DONN-NOO 0 2 1 2 2 0 0 R 225 227 214 219 226 195 183 233 240 222 Print PG-13 50 45 45 40 45 9 150 8 145 143 140 142 79 141 165 146 137 18%22ON PG 59 64 53 59 70 47 62 59 87 68 9 Done G 11 WA 004 NN 12 12 19 7 18 21 14 Full data set o Not Rated 345 291 284 271 254 210 120 237 262 276 I X
Step by Step Solution
3.42 Rating (155 Votes )
There are 3 Steps involved in it
The data is given below showing the combined values from 2006 to 2010 and 2011 to 2015 NC 17 From 20... View full answer

Get step-by-step solutions from verified subject matter experts