

Question: Data Tables: Table 1 - Part A Initial concentrations of F e 3 + and S C N - in Unknown Mixtures Table 2 -
Data Tables:
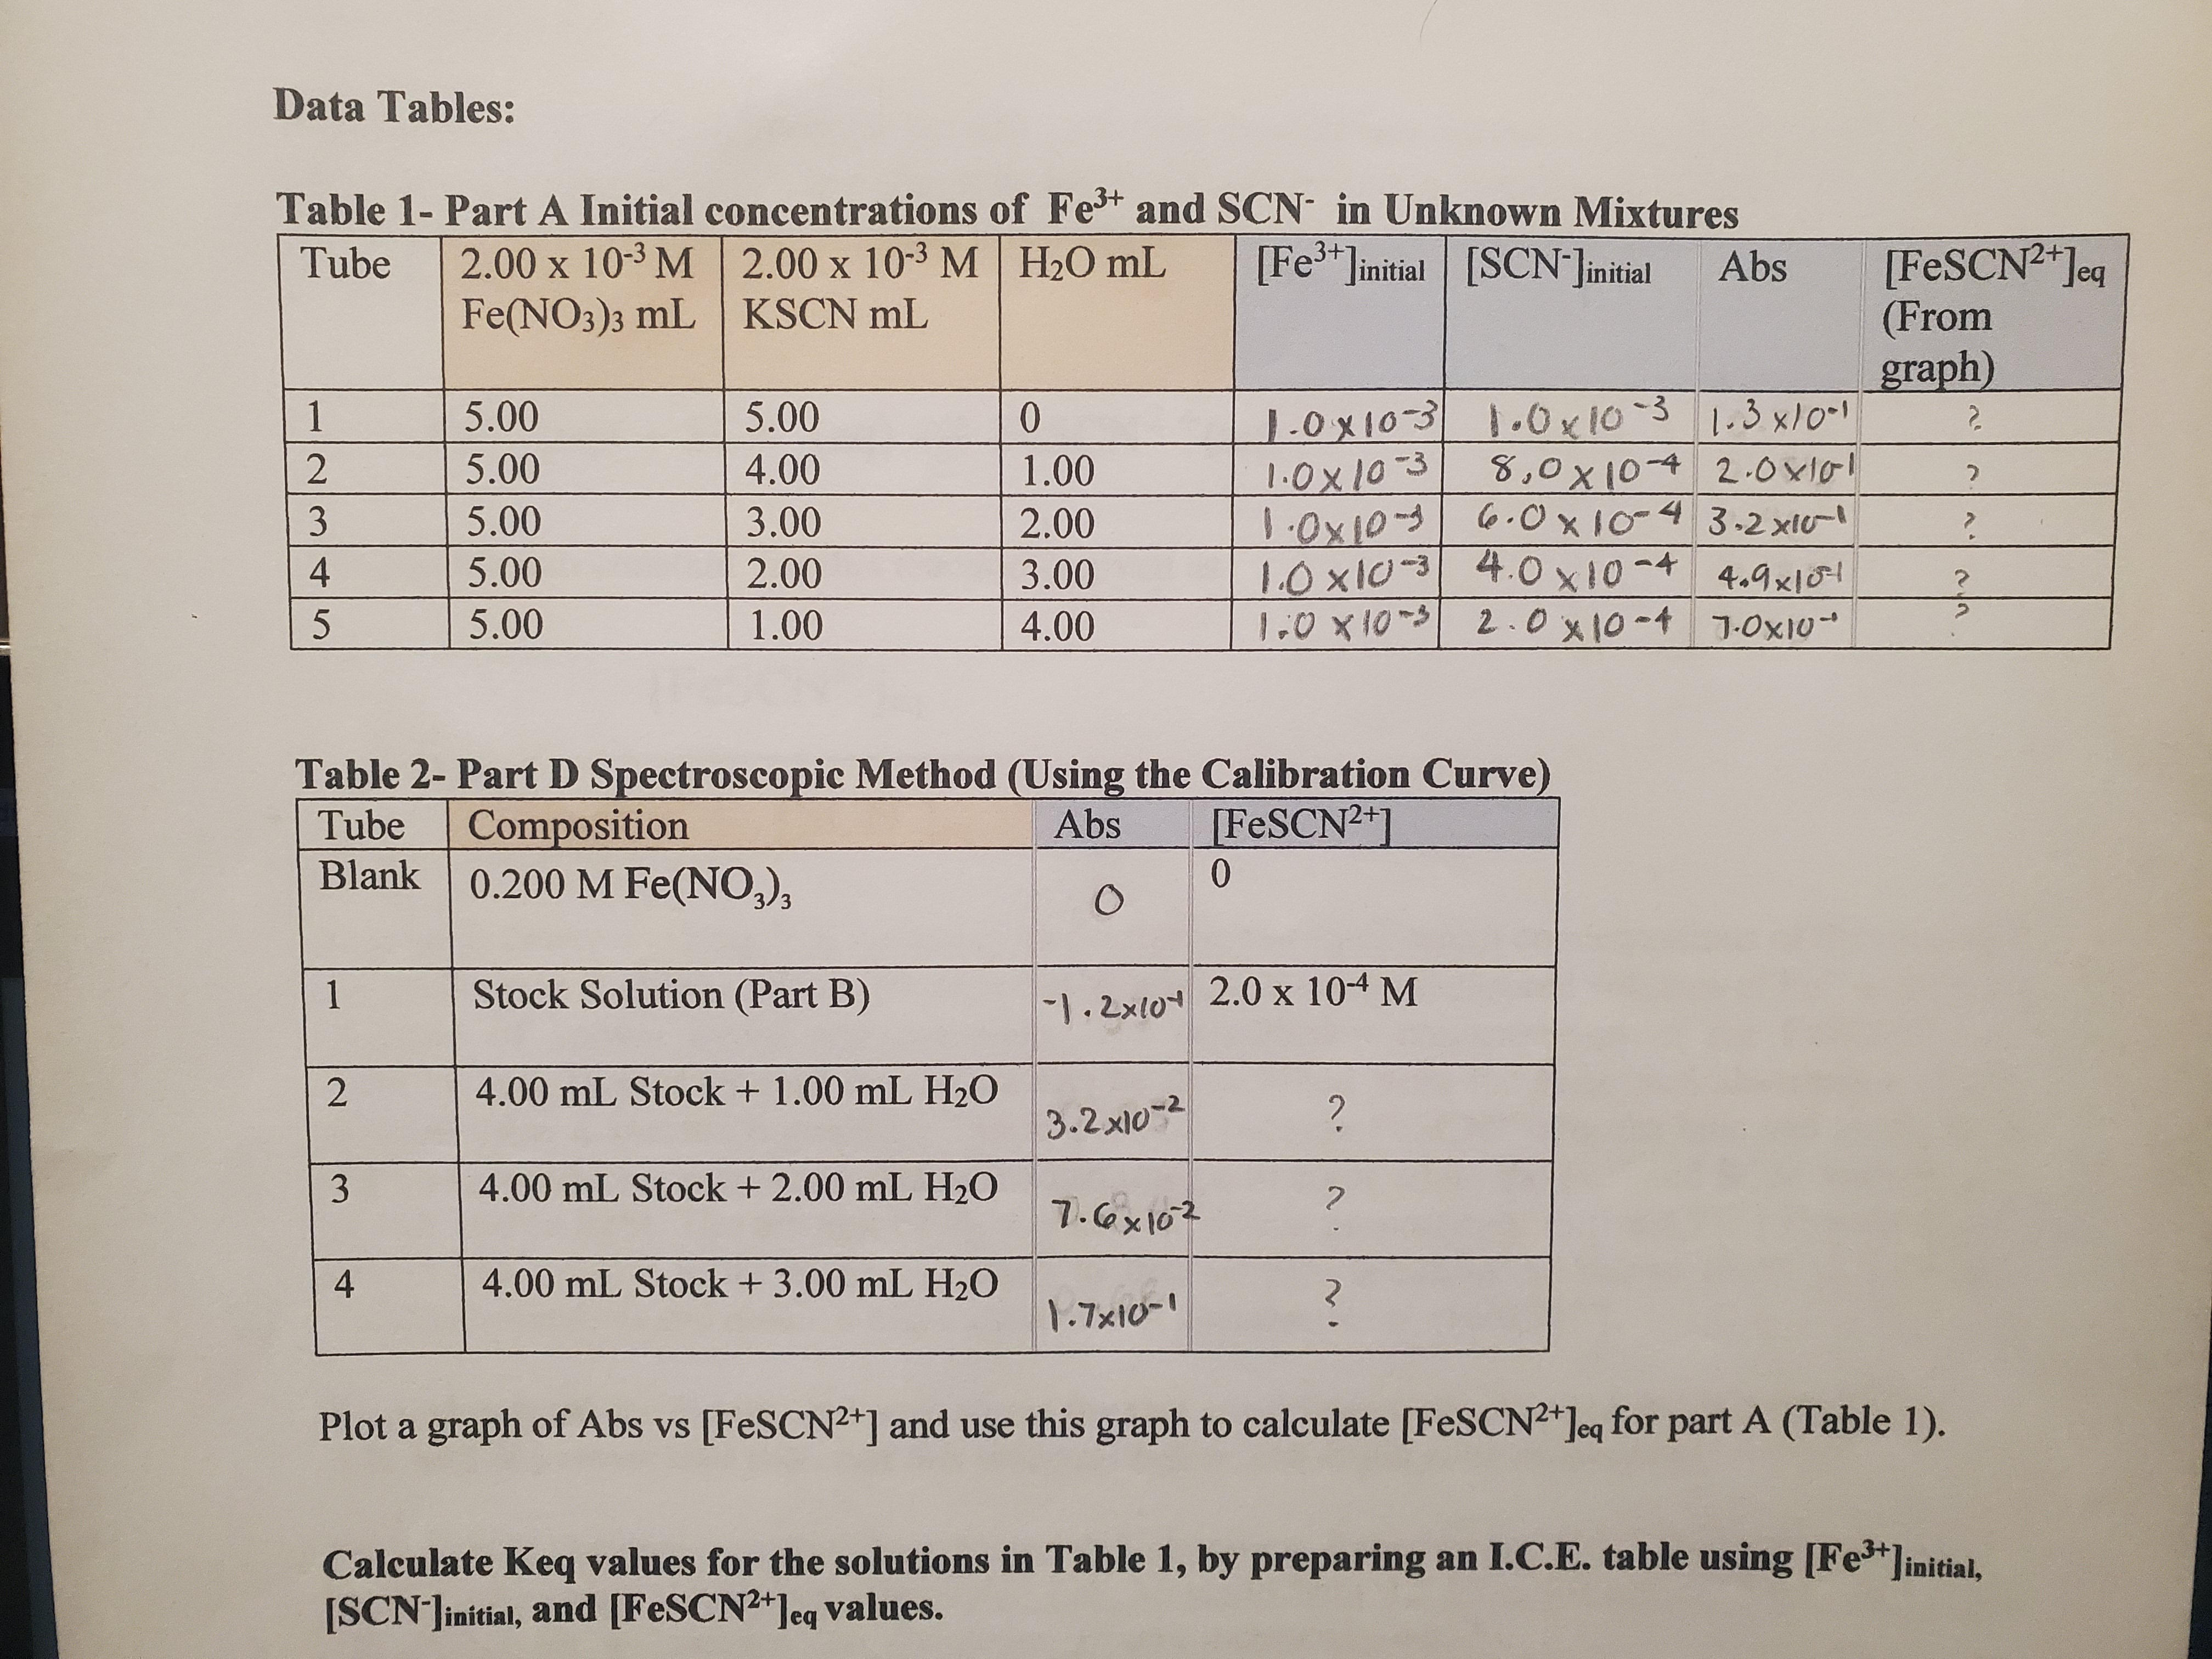
Table Part A Initial concentrations of and in Unknown Mixtures
Table Part D Spectroscopic Method Using the Calibration Curve
Plot a graph of Abs vs and use this graph to calculate eq for part A Table
Calculate Keq values for the solutions in Table by preparing an I.CE table using initial,
and values.
Step by Step Solution
There are 3 Steps involved in it
1 Expert Approved Answer
Step: 1 Unlock

Question Has Been Solved by an Expert!
Get step-by-step solutions from verified subject matter experts
Step: 2 Unlock
Step: 3 Unlock