

Question: data to question help with coding 0 0 0.4 6 10.3 30 0.87 24.8 1.76 51 82 120.167 2.28 60 Plotting in MATLAB is a
data to question
help with coding
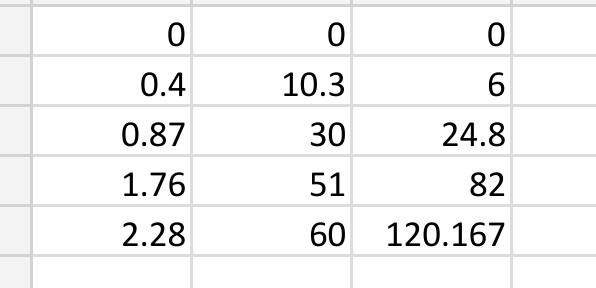
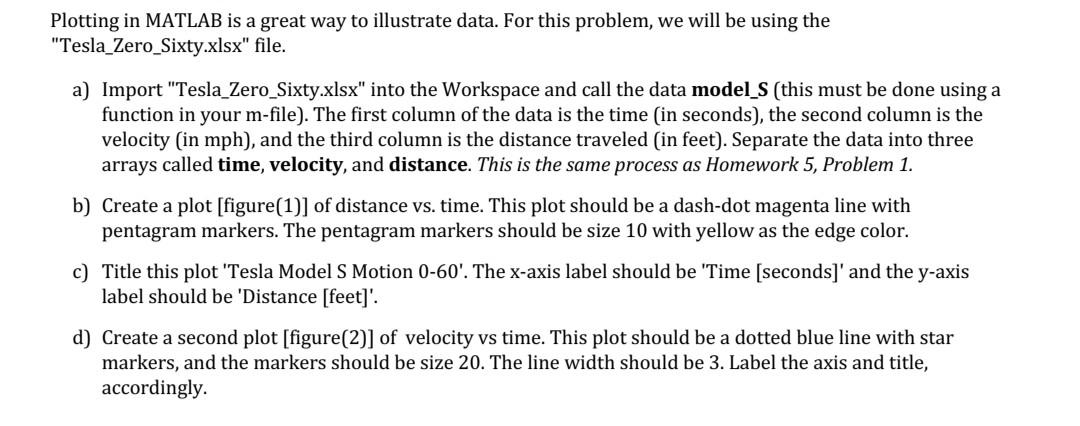
0 0 0.4 6 10.3 30 0.87 24.8 1.76 51 82 120.167 2.28 60 Plotting in MATLAB is a great way to illustrate data. For this problem, we will be using the "Tesla_Zero_Sixty.xlsx" file. a) Import "Tesla_Zero_Sixty.xlsx" into the Workspace and call the data model_S (this must be done using a function in your m-file). The first column of the data is the time in seconds), the second column is the velocity (in mph), and the third column is the distance traveled (in feet). Separate the data into three arrays called time, velocity, and distance. This is the same process as Homework 5, Problem 1. b) Create a plot [figure(1)] of distance vs. time. This plot should be a dash-dot magenta line with pentagram markers. The pentagram markers should be size 10 with yellow as the edge color. c) Title this plot 'Tesla Model S Motion 0-60'. The x-axis label should be 'Time [seconds)' and the y-axis label should be 'Distance [feet]'. d) Create a second plot [figure(2)] of velocity vs time. This plot should be a dotted blue line with star markers, and the markers should be size 20. The line width should be 3. Label the axis and title, accordingly
Step by Step Solution
There are 3 Steps involved in it

Get step-by-step solutions from verified subject matter experts