

Question: data Using the accompanying Accounting Professionnis data to answer the following questions. a. Find and interpreta 95% confidence interval for the mean years of service
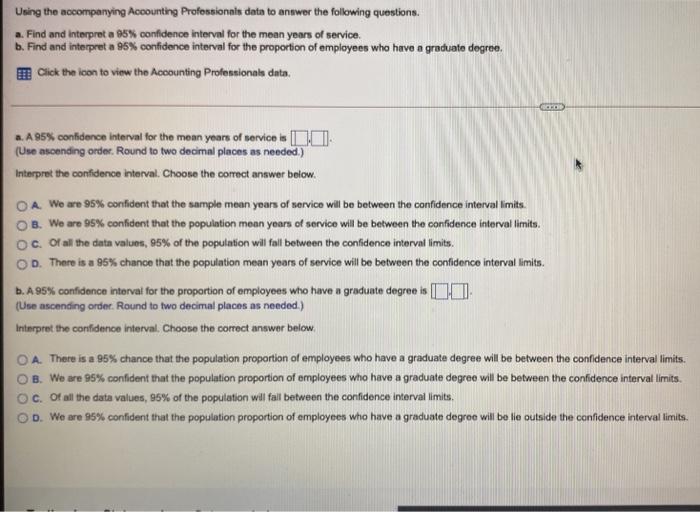
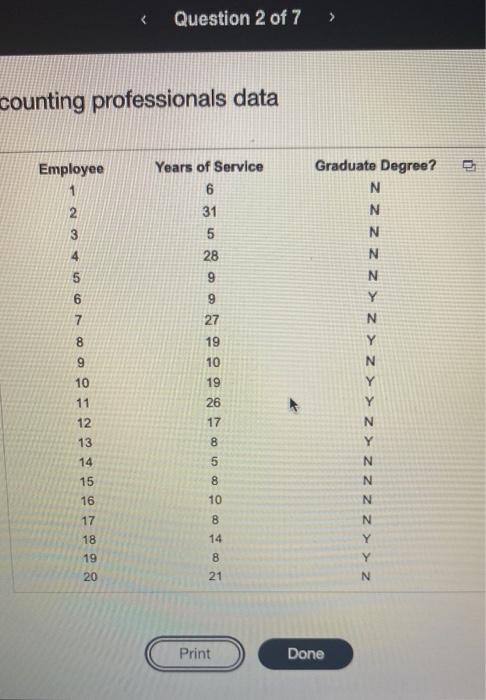
Using the accompanying Accounting Professionnis data to answer the following questions. a. Find and interpreta 95% confidence interval for the mean years of service b. Find and interpreta 95% confidence interval for the proportion of employees who have a graduate degree. Click the icon to view the Accounting Professional data. ICO a. A 95% confidence interval for the mean years of service is LI- (Use ascending order. Round to two decimal places as needed) Interpret the confidence interval. Choose the correct answer below. OA. We are 95% confident that the sample mean years of service will be between the confidence interval limits OB. We are 95% confident that the population mean years of service will be between the confidence interval limits. oc. Of all the data values, 95% of the population will fall between the confidence interval limits. OD. There is a 95% chance that the population mean years of service will be between the confidence interval limits. b. A 95% confidence interval for the proportion of employees who have a graduate degree is 1). (Use ascending order. Round to two decimal places as needed) Interpret the confidence interval. Choose the correct answer below. O A. There is a 95% chance that the population proportion of employees who have a graduate degree will be between the confidence interval limits. OB. We are 95% confident that the population proportion of employees who have a graduate degree will be between the confidence interval limits. OC. Of all the data values, 96% of the population will fall between the confidence interval limits. D. We are 95% confident that the population proportion of employees who have a graduate degree will be le outside the confidence interval limits. Question 2 of 7 > counting professionals data e Graduate Degree? N Employee 1 2 3 Years of Service 6 31 5 28 9 N N 4 5 6 9 N N Y N Y 7 8 27 19 10 N 19 9 10 11 12 13 26 17 8 Y 14 5 15 8 ->Z> Z z zz>> Z 16 N N N Y 10 17 8 14 18 19 8 Y 20 21 N Print Done
Step by Step Solution
There are 3 Steps involved in it

Get step-by-step solutions from verified subject matter experts