

Question: Data visualization cannot be used for which of the following? Revealing trends Correcting for sampling error Comparing groups Identifying correlations Highlighting key facts Moving to
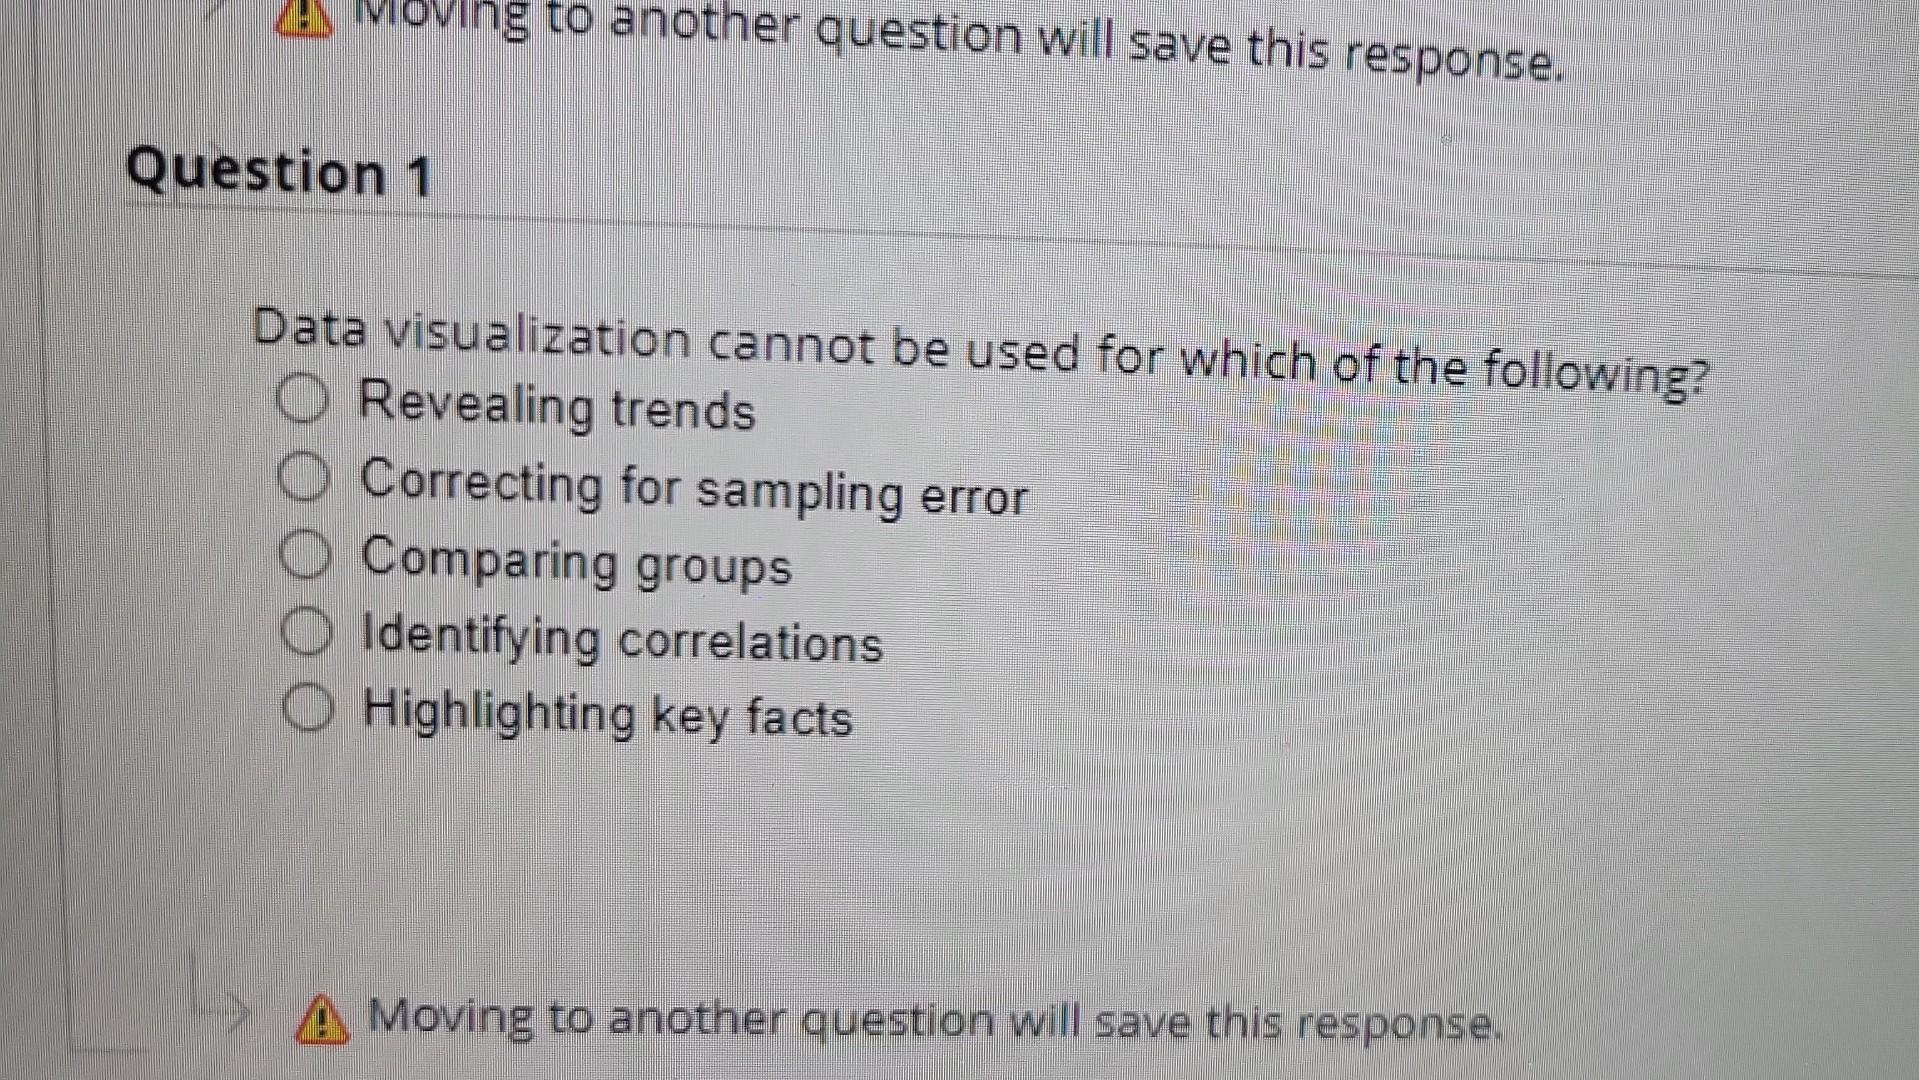
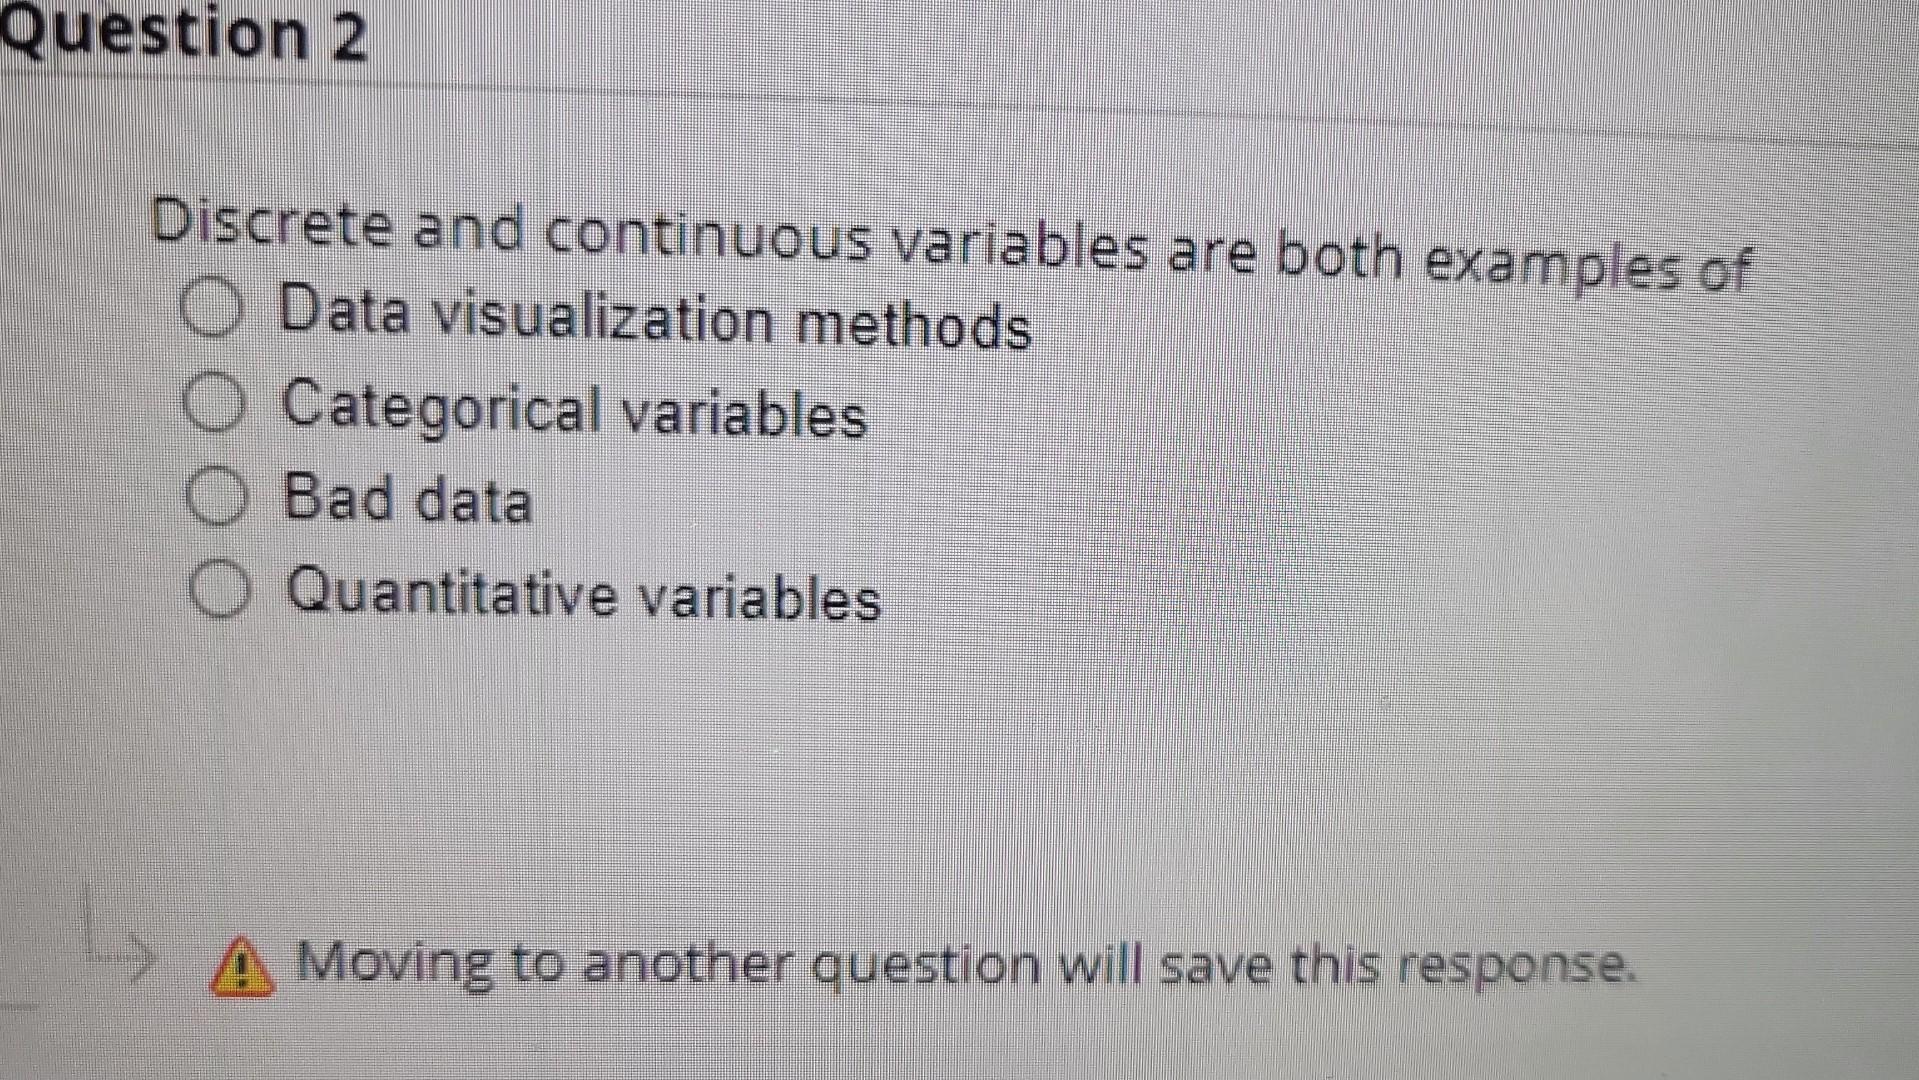
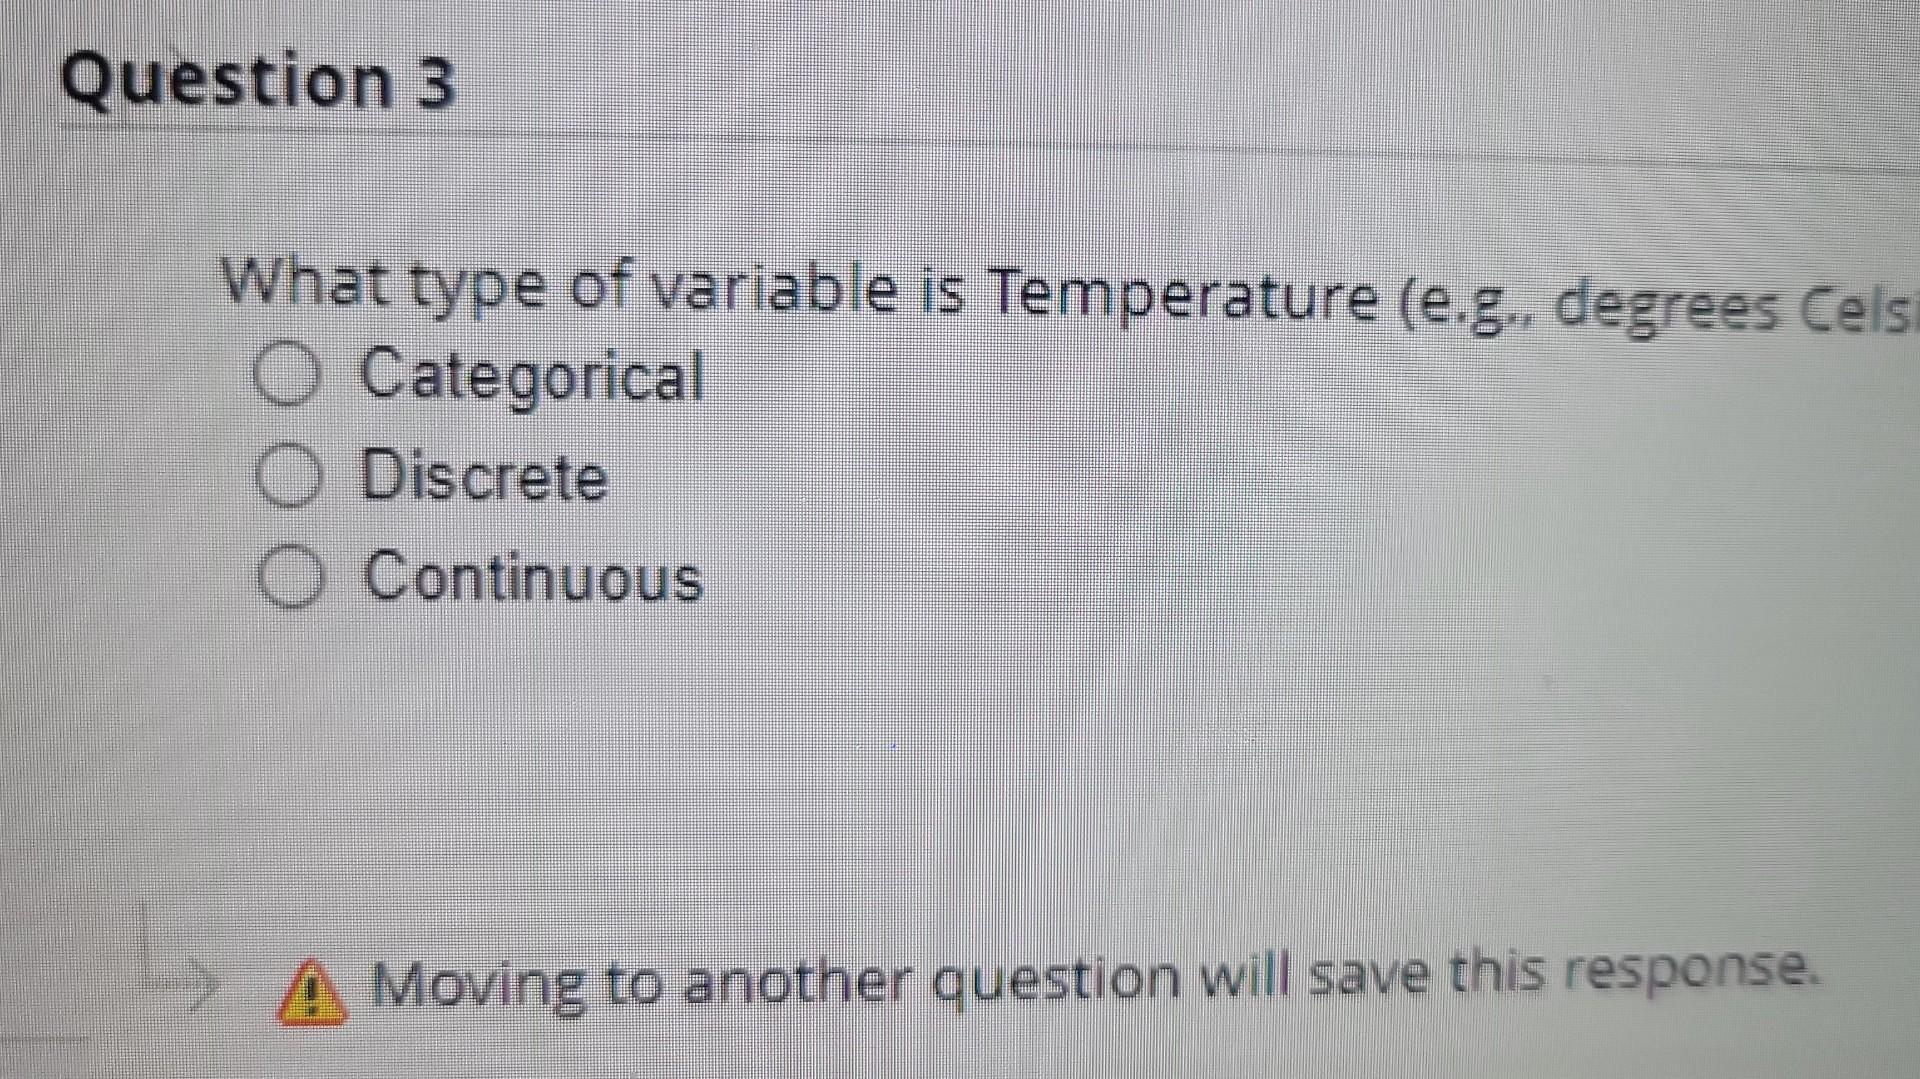
Data visualization cannot be used for which of the following? Revealing trends Correcting for sampling error Comparing groups Identifying correlations Highlighting key facts Moving to another question will save this response. Discrete and continuous variables are both examples of Data visualization methods Categorical variables Bad data Quantitative variables Moving to another question will save this response. What type of variable is Temperature (e.g. , degrees Cels Categorical Discrete Continuous Moving to another question will save this response
Step by Step Solution
There are 3 Steps involved in it
1 Expert Approved Answer
Step: 1 Unlock

Question Has Been Solved by an Expert!
Get step-by-step solutions from verified subject matter experts
Step: 2 Unlock
Step: 3 Unlock