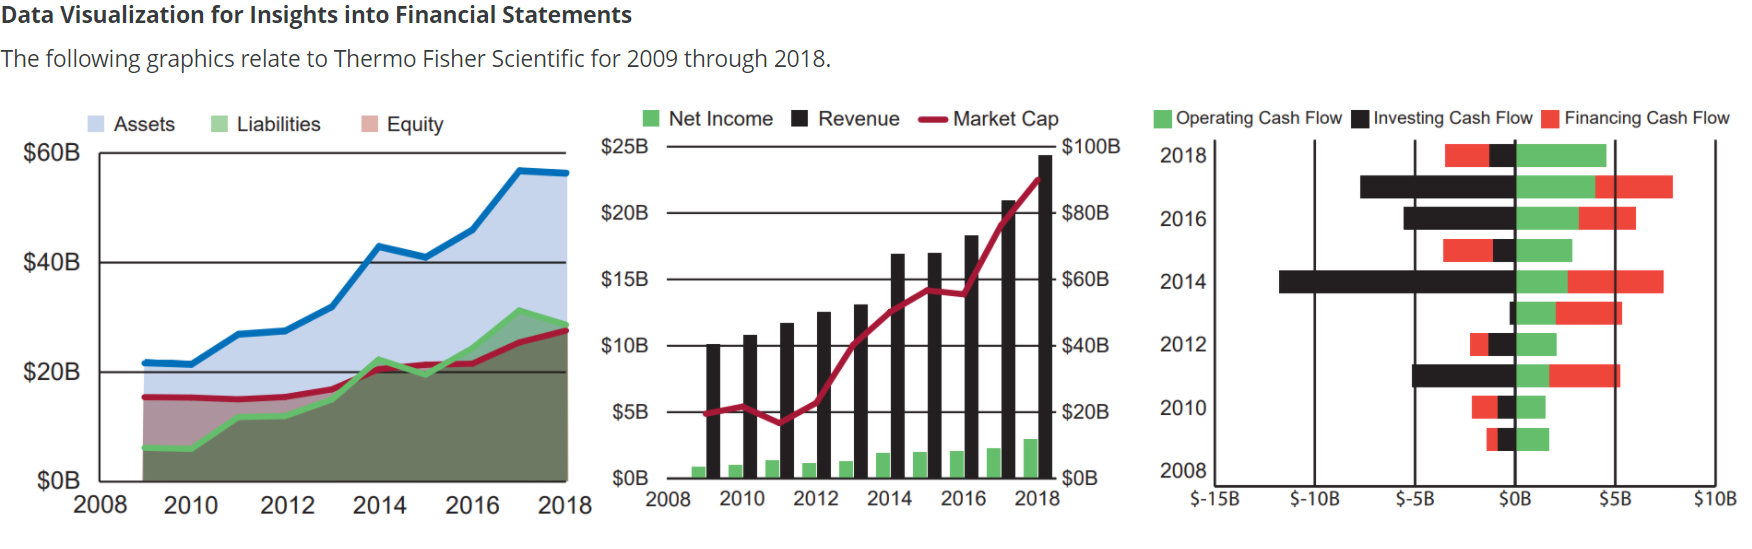
Question: Data Visualization for Insights into Financial Statements The following graphics relate to Thermo Fisher Scientific for 2009 through 2018. Assets l Liabilities I Equity I

Data Visualization for Insights into Financial
Data Visualization for Insights into Financial Statements The following graphics relate to Thermo Fisher Scientific for 2009 through 2018. Assets l Liabilities I Equity I Net Income I Revenue Market Cap $60B $253 $1003 $203 $303 $403 $153 $603 $103 $403 $20B $53 $203 $0B $03 $03 2008 2010 2012 2014 2016 2018 2008 2010 2012 2014 2016 2015 I Operaling Cash Flow I Investing Cash Flow I Financing Cash Flow 2018 2016 2014 2012 2010 2008 5-1 SB S-IOB I: E 5-5 B SOB :- :- $53 $103

Step by Step Solution

There are 3 Steps involved in it

1 Expert Approved Answer
Step: 1 Unlock blur-text-image
Question Has Been Solved by an Expert!

Get step-by-step solutions from verified subject matter experts

Step: 2 Unlock
Step: 3 Unlock

Students Have Also Explored These Related Accounting Questions!