

Question: Data Visualization II Hi there, Please can you assist with below. * Compulsory Task 1 , AND * Compulsory Task 2 Thank you kindly in
Data Visualization II
Hi there, Please can you assist with below.
* Compulsory Task 1 , AND
* Compulsory Task 2
Thank you kindly in advance :)
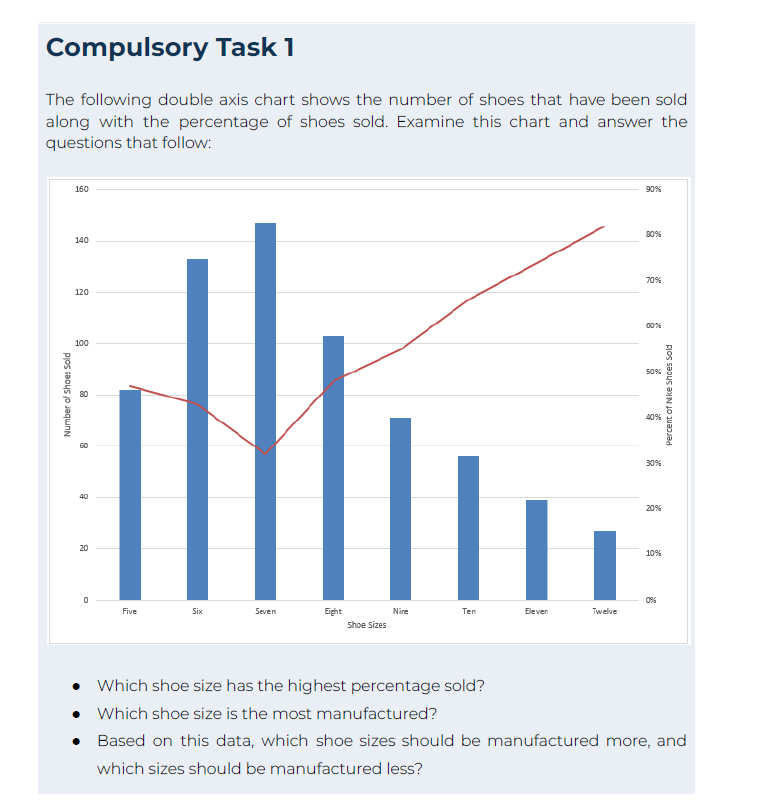
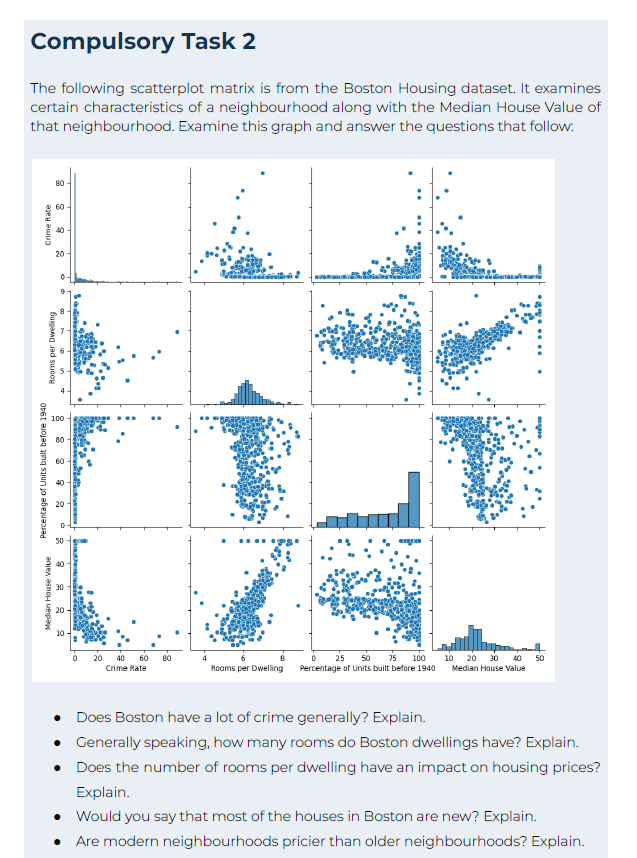
Compulsory Task 1 The following double axis chart shows the number of shoes that have been sold along with the percentage of shoes sold. Examine this chart and answer the questions that follow: - Which shoe size has the highest percentage sold? - Which shoe size is the most manufactured? - Based on this data, which shoe sizes should be manufactured more, and which sizes should be manufactured less? The following scatterplot matrix is from the Boston Housing dataset. It examines certain characteristics of a neighbourhood along with the Median House Value of that neighbourhood. Examine this graph and answer the questions that follow: - Does Boston have a lot of crime generally? Explain. - Generally speaking, how many rooms do Boston dwellings have? Explain. - Does the number of rooms per dwelling have an impact on housing prices? Explain. - Would you say that most of the houses in Boston are new? Explain. - Are modern neighbourhoods pricier than older neighbourhoods? Explain
Step by Step Solution
There are 3 Steps involved in it

Get step-by-step solutions from verified subject matter experts