

Question: Data was collected from around 1 : 0 0 pm on 9 / 1 2 / 2 0 2 3 until 9 : 0 0
Data was collected from around : pm on until : am on Answer the following questions.
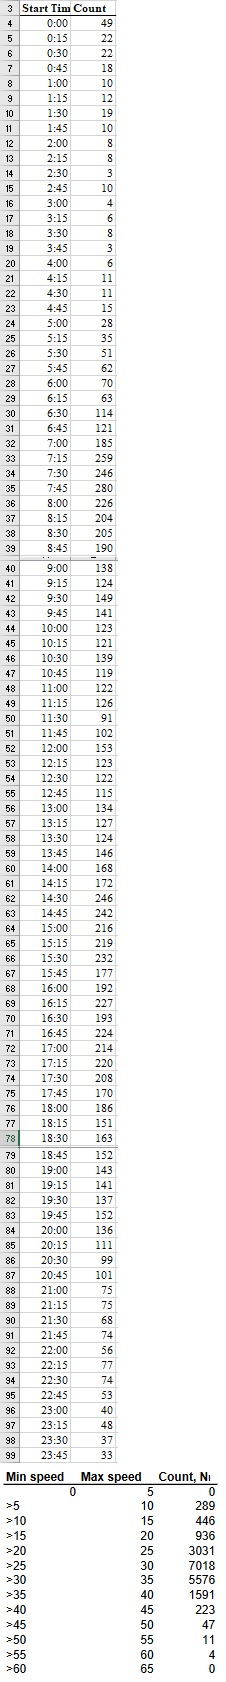
Speed distribution plot
Using the data in the speed data tab,
Create a cumulative distribution plot of speeds: You should use the speed bins classes as provided in the data,
Determine the mean, mode, and median speeds round to nearest whole speed
Determine the standard deviation of speeds use one decimal place
Determine the pace use a mph increment and
Determine the th percentile speed. How does this compare to the posted speed limit at the location?
Volume Plot
Using the data in the volume data tab
Create a plot to show the total volume for each hour and discuss any noted trends.
Determine the peak hour and peak hour factor on
Determine the hourly expansion factor on for the time period provided to you.
Step by Step Solution
There are 3 Steps involved in it
1 Expert Approved Answer
Step: 1 Unlock

Question Has Been Solved by an Expert!
Get step-by-step solutions from verified subject matter experts
Step: 2 Unlock
Step: 3 Unlock