

Question: Data were collected on a random sample of 100 low birthweight, pre-term infants born in a large Boston (Massachusetts, US) teaching hospital. Infants in the
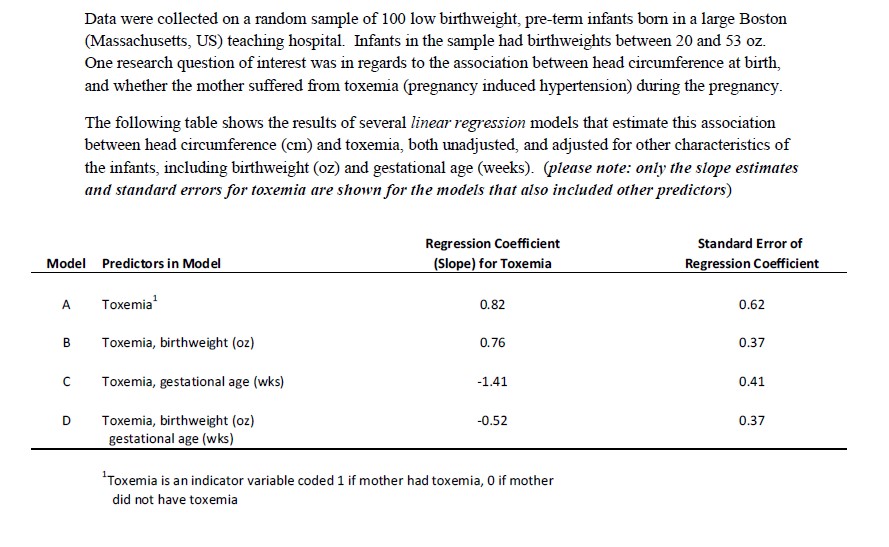
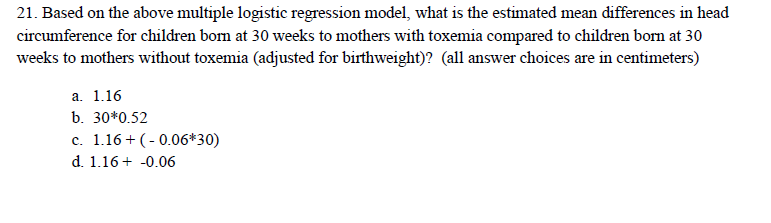
Data were collected on a random sample of 100 low birthweight, pre-term infants born in a large Boston (Massachusetts, US) teaching hospital. Infants in the sample had birthweights between 20 and 53 oz. One research question of interest was in regards to the association between head circumference at birth, and whether the mother suffered from toxemia (pregnancy induced hypertension) during the pregnancy. The following table shows the results of several linear regression models that estimate this association between head circumference (cm) and toxemia, both unadjusted, and adjusted for other characteristics of the infants, including birthweight (oz) and gestational age (weeks). (please note: only the slope estimates and standard errors for toxemia are shown for the models that also included other predictors) Regression Coefficient Standard Error of Model Predictors in Model (Slope) for Toxemia Regression Coefficient A Toxemia 0.82 0.62 B Toxemia, birthweight (oz) 0.76 0.37 C Toxemia, gestational age (wks) -1.41 0.41 D Toxemia, birthweight (oz) -0.52 0.37 gestational age (wks) `Toxemia is an indicator variable coded 1 if mother had toxemia, 0 if mother did not have toxemia21. Based on the above multiple logistic regression model, what is the estimated mean differences in head circumference for children born at 30 weeks to mothers with toxemia compared to children born at 30 weeks to mothers without toxemia (adjusted for birthweight)? (all answer choices are in centimeters) a. 1.16 b. 30*0.52 c. 1.16 + ( - 0.06*30) d. 1.16+ -0.06
Step by Step Solution
There are 3 Steps involved in it

Get step-by-step solutions from verified subject matter experts