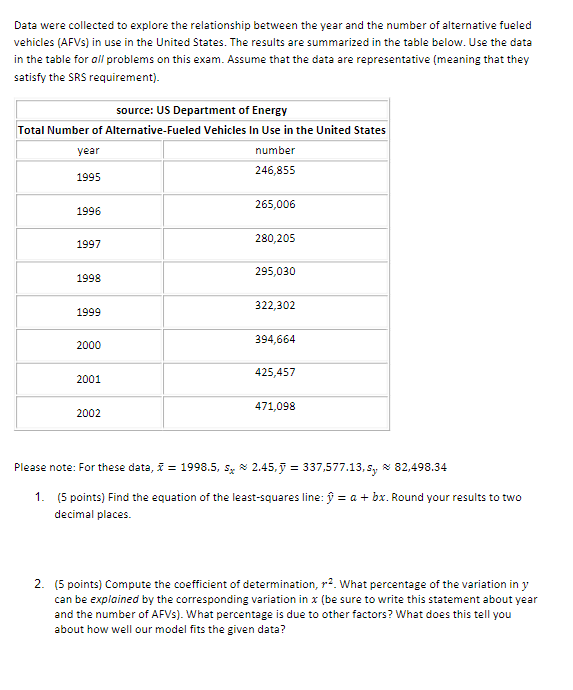
Question: Data were collected to explore the relationship between the year and the number of alternative fueled vehicles (AFVs) in use in the United States. The

Data were collected to explore the relationshipData were collected to explore the relationshipData were collected to explore the relationship

Data were collected to explore the relationship between the year and the number of alternative fueled vehicles (AFVs) in use in the United States. The results are summarized in the table below. Use the data in the table for all problems on this exam. Assume that the data are representative (meaning that they satisfy the SRS requirement). source: US Department of Energy Total Number of Alternative-Fueled Vehicles In Use in the United States year number 1995 246,855 265,006 1996 1997 280,205 295,030 1998 322,302 1999 2000 394,664 2001 425,457 471,098 2002 = Please note: For these data, i = 1998.5, 5x2.45, y = 337,577.13, sy 82,498.34 1. (5 points) Find the equation of the least-squares line: y = a + bx. Round your results to two decimal places. 2. (5 points) Compute the coefficient of determination, r2. What percentage of the variation in y can be explained by the corresponding variation in x (be sure to write this statement about year and the number of AFVS). What percentage is due to other factors? What does this tell you about how well our model fits the given data? 3. (5 points) Interpret the slope of your least-squares line in the context of this application (what does the specific numeric value of the slope mean in terms of the relationship between the year and number of AFVS?). 4. Use a 5% level of significance to test the claim that p > 0. a. (2 points) State the null and alternative hypotheses. Ho! HA b. (2 points) What calculator test will you use? List the requirements that must be met for you to use this test, and indicate whether the conditions are met in this problem. C. (2 points) Run the calculator test and obtain the P-value. d. (2 points) Based on your P-value, will you reject or fail to reject the null hypothesis? e. (2 points) Interpret your conclusion from part d in the context of this problem. In other words, what does this result tell you about the population correlation between the year and number of AFVS

Step by Step Solution

There are 3 Steps involved in it

1 Expert Approved Answer
Step: 1 Unlock blur-text-image
Question Has Been Solved by an Expert!

Get step-by-step solutions from verified subject matter experts

Step: 2 Unlock
Step: 3 Unlock

Students Have Also Explored These Related General Management Questions!