

Question: DATAfile: Dish The weekly demand (In cases) for a particuts grocery stores located in Columbus, Ohio, follows. Week Demand 22 18 3 23 21 17
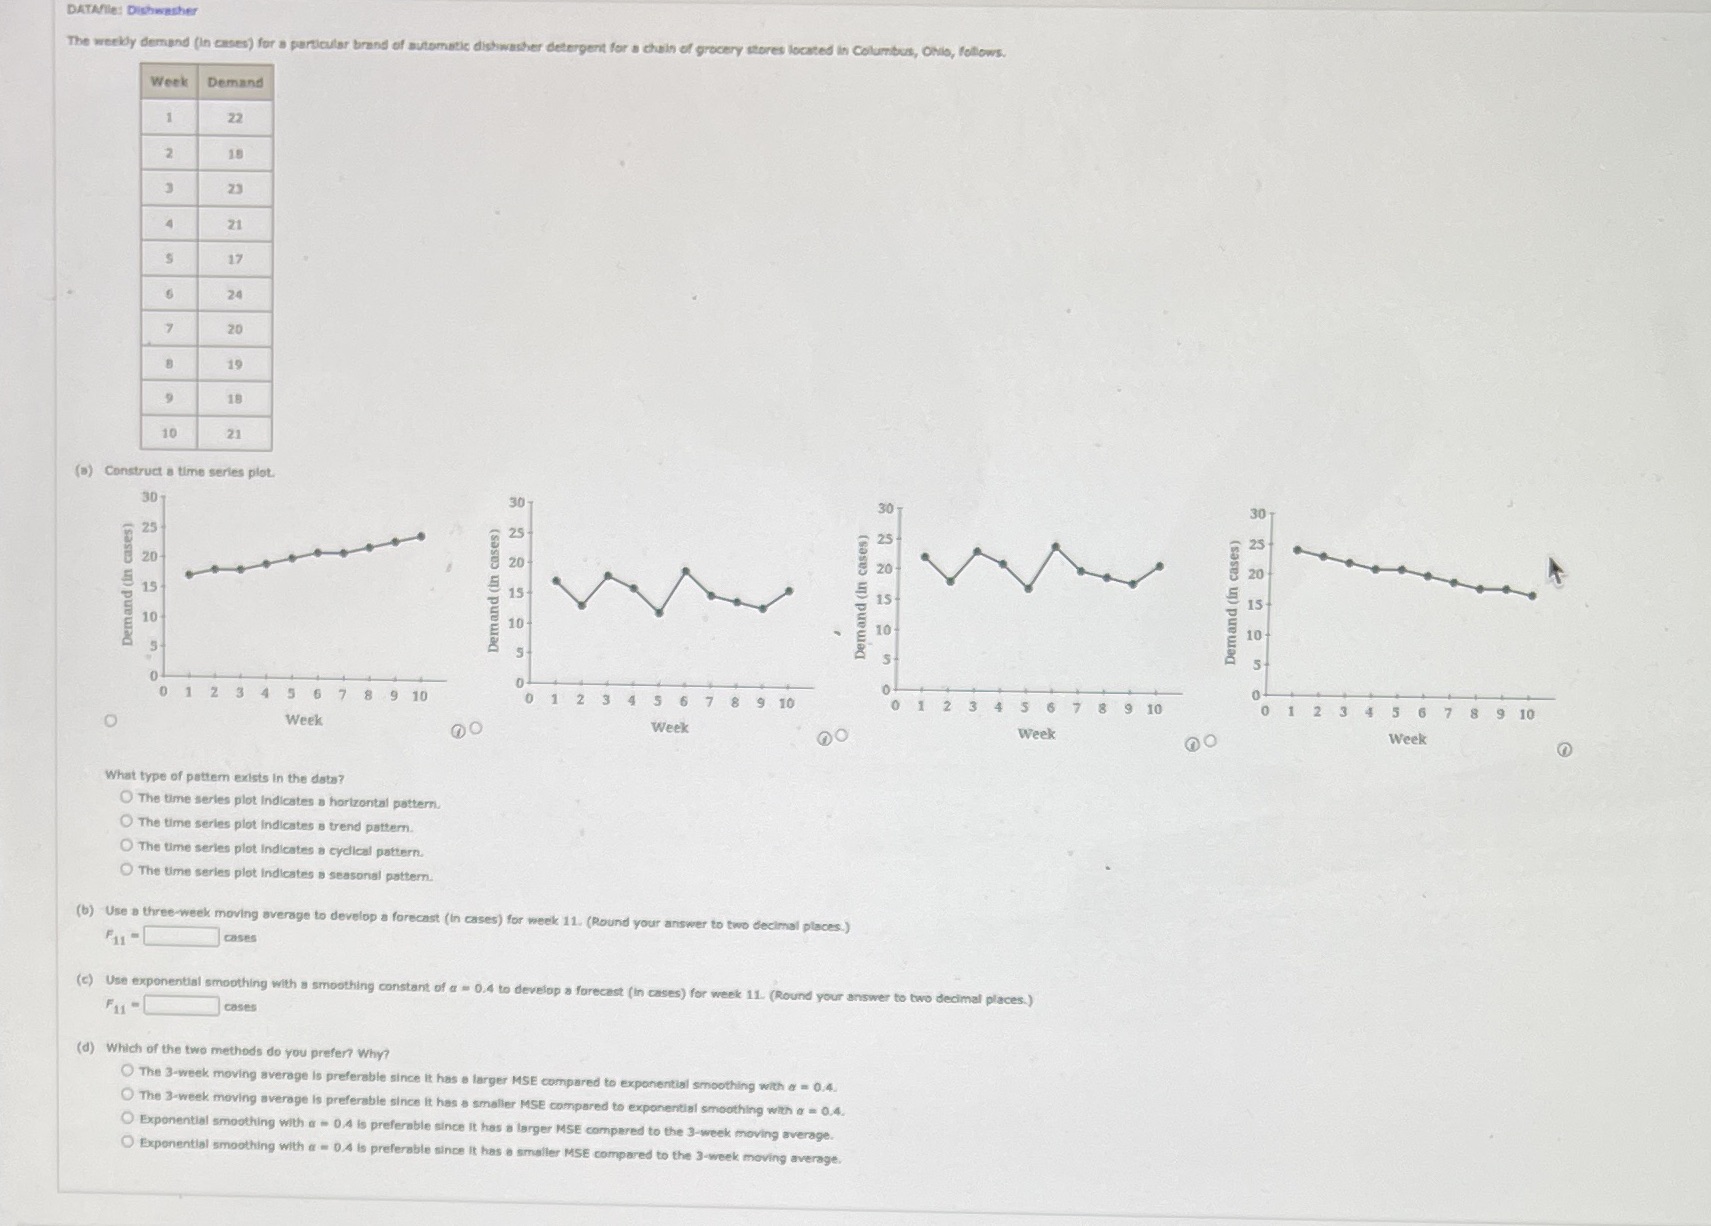
DATAfile: Dish The weekly demand (In cases) for a particuts grocery stores located in Columbus, Ohio, follows. Week Demand 22 18 3 23 21 17 6 24 7 20 19 18 10 21 () Construct a time series plot 30 30 30 Demand (in cases) Demand (in cases) Demand (in cases) Demand (in cases) 0 1 8 9 10 0 1 2 3 4 5 6 7 8 9 10 2 8 9 10 0 1 2 3 4 5 6 7 8 9 10 Week Week Week Week What type of pattern exists In the data? The time series plot Indicates a horizontal pattern. The time series plot Indicates a trend pattern. The time series plot Indicates a cyclical pattern. The time series plot Indicates a seasonal pattern. (b) Use a three-week moving average to develop a forecast (in cases) for week 11. (Round your answer to two decimal places.) cases (c) Use exponential smoothing with a smoothing constant of a = 0.4 to develop a forecast (in cases) for week 11. (Round your answer to two decimal places.) cases (d) Which of the two methods do you prefer? Why? The 3-week moving average is preferable since it othing with a = 0.4. The 3-week moving average is preferable since it has smoothing with a = 0.4. OExpon othing with a ed to the 3-week moving average. OF the 3-week moving average
Step by Step Solution
There are 3 Steps involved in it

Get step-by-step solutions from verified subject matter experts