

Question: Dataset Description The data set being analysed comprises the study of 49 candidates for recruitment to be emergency health workers. Each recruit was given a
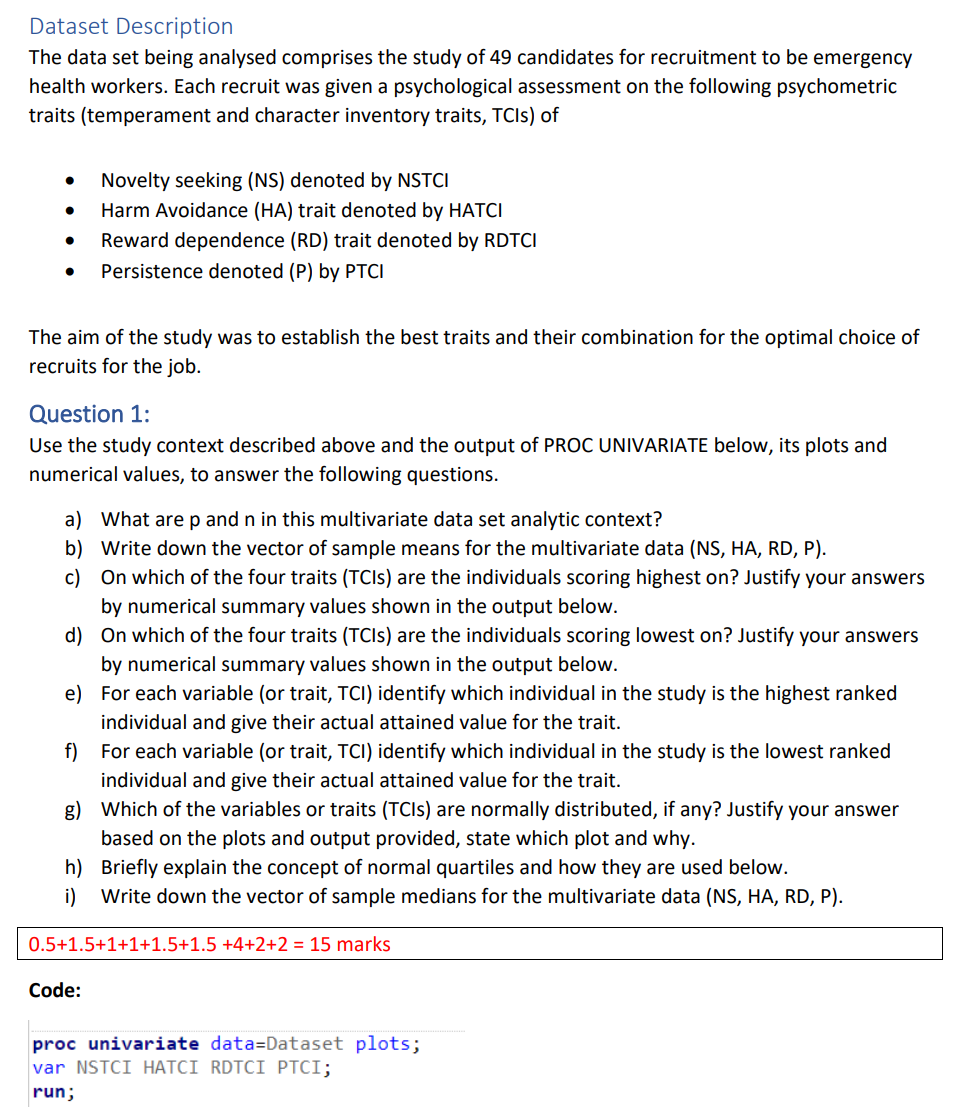
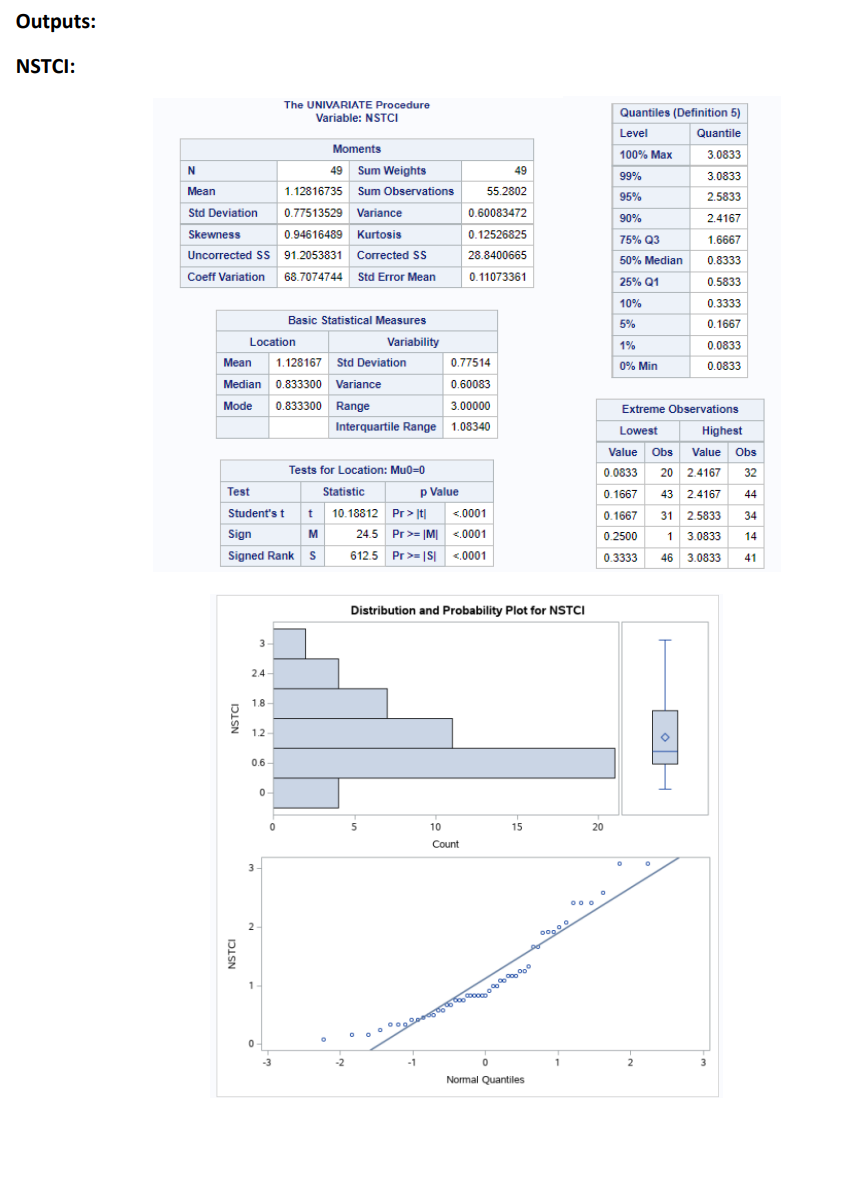
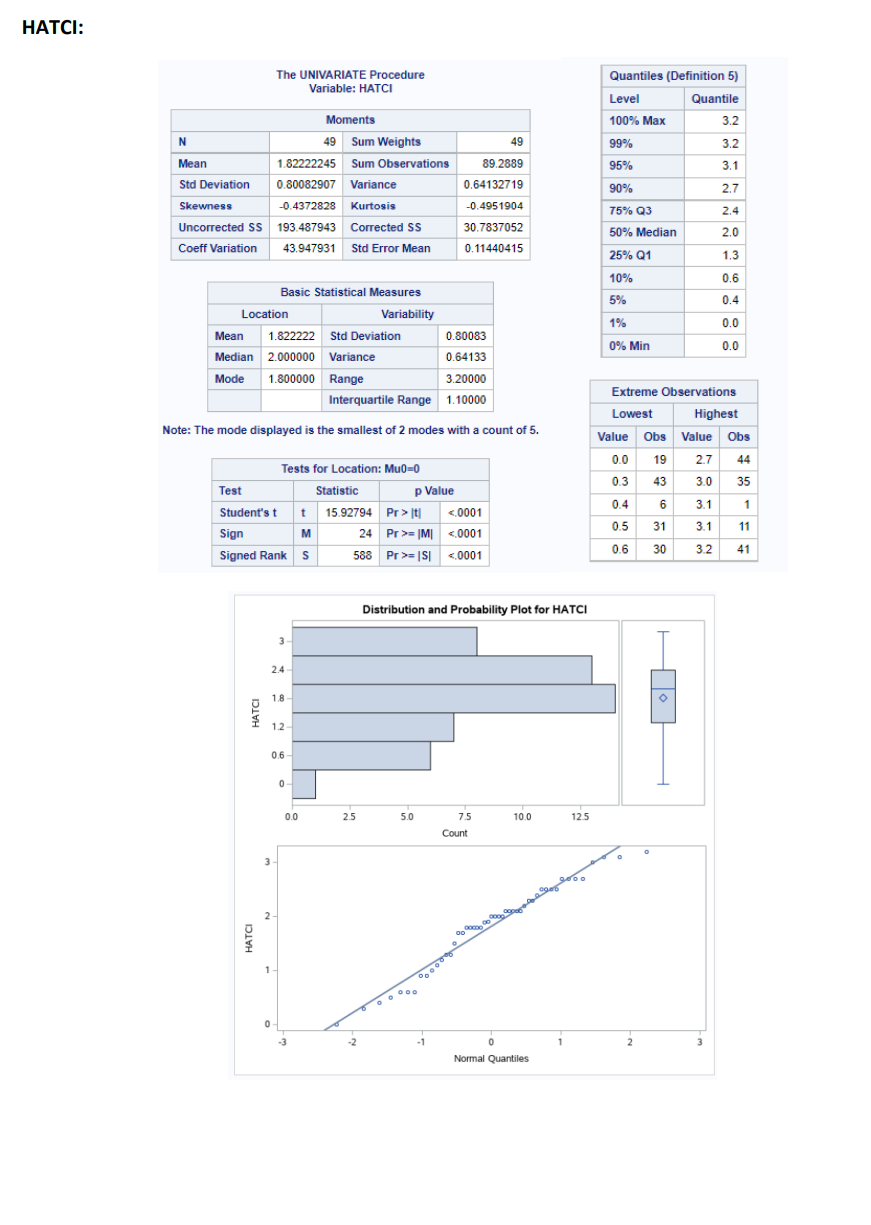
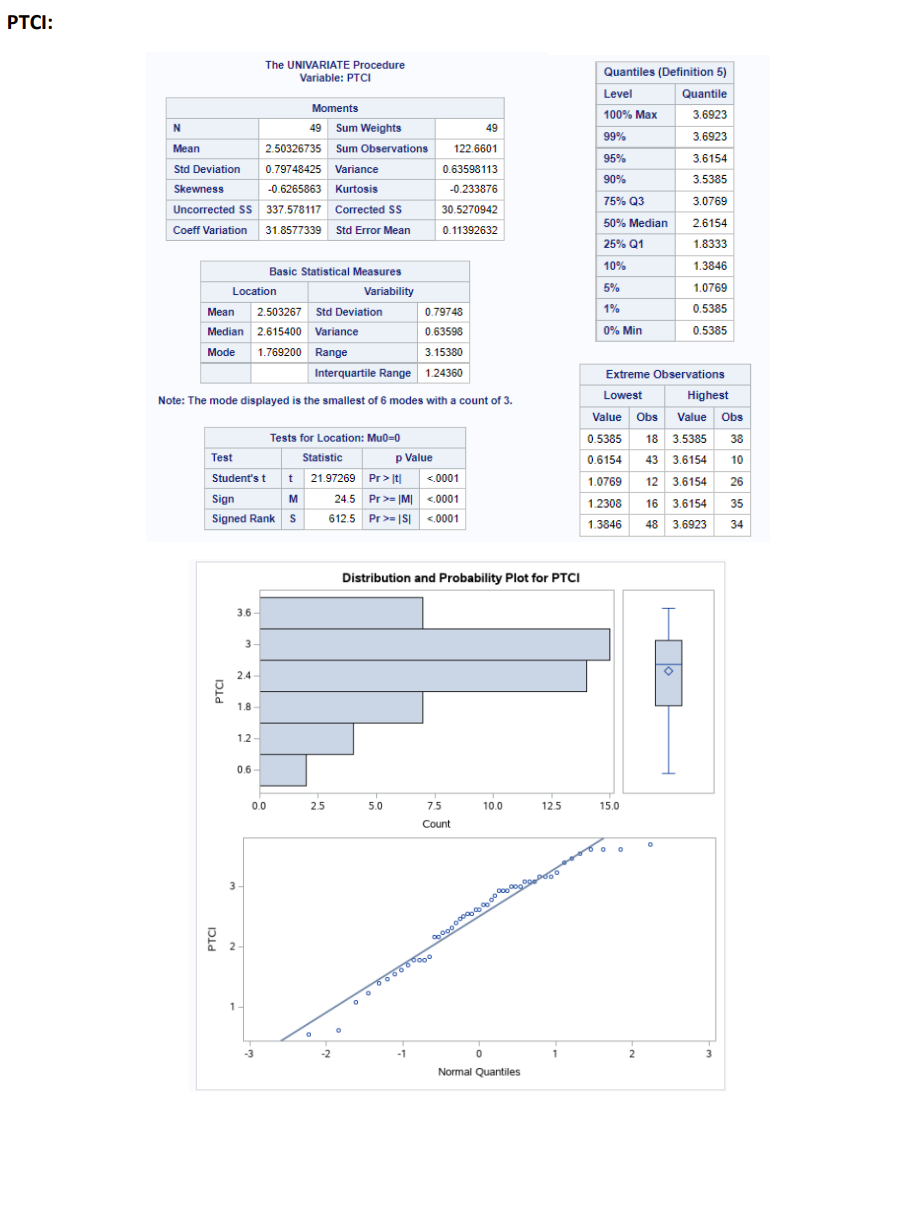
Dataset Description The data set being analysed comprises the study of 49 candidates for recruitment to be emergency health workers. Each recruit was given a psychological assessment on the following psychometric traits (temperament and character inventory traits, TCIs) of Novelty seeking (NS) denoted by NSTCI Harm Avoidance (HA) trait denoted by HATCI Reward dependence {RD} trait denoted by RDTCI Persistence denoted (P) by PTCI The aim of the study was to establish the best traits and their combination for the optimal choice of recruits for the job. Question 1: Use the study context described above and the output of PROC UNIVARIATE below, its plots and numerical values, to answer the following questions. 8) bl Cl dl 8) fl gl hi i) What are p and n in this multivariate data set analytic context? Write down the vector of sample means for the multivariate data (NS, HA, RD, P). On which of the four traits {TCIs) are the individuals scoring highest on? Justify your answers by numerical summary values shown in the Output below. On which of the four traits {TCIs) are the individuals scoring lowest on? Justify your answers by numerical summary values shown in the output below. For each variable (or trait, TCI] identify which individual in the study is the highest ranked individual and give their actual attained value for the trait. For each variable (or trait, TCI) identify which individual in the study is the lowest ranked individual and give their actual attained value for the trait. Which of the variables or traits (TCIs) are normally distributed, if any? Justify your answer based on the plots and output provided, state which plot and why. Briefly explain the concept of normal quartiles and how they are used below. Write down the vector of sample medians for the multivariate data (NS, HA, RD, P). 0.5+1.5+1+1+1.5+1.5 +4+2+2 = 15 marks Code: proc univariate data=3ataset plots; var' ll'wii'l Hill-1i iiIHtl PH 1; run; \fHATCI: The UNIVARIATE Procedure Quantiles (Definition 5) Variable: HATCI Level Quantile Moments 100% Max 3.2 N 9 Sum Weights 49 99% 3.2 Mean 1.82222245 Sum Observations 89.2889 95% 3.1 Std Deviation 0.80082907 Variance 0.64132719 90% 2.7 Skewness 0.4372828 Kurtosis 0.4951904 75% Q3 2.4 Uncorrected SS 193.487943 Corrected SS 30.7837052 50% Median 2.0 Coeff Variation 43.947931 Std Error Mean 0. 11440415 25% Q1 1.3 10% 0.6 Basic Statistical Measures 5% 0.4 Location Variability 1% 0.0 Mean 1.822222 Std Deviation 0.80083 0% Min 0.0 Median 2.000000 Variance 0.64133 Mode 1.800000 Range 3.20000 Extreme Observations Interquartile Range 1.10000 Lowest Highest Note: The mode displayed is the smallest of 2 modes with a count of 5. Value Obs Value Obs 0.0 19 2.7 44 Tests for Location: Mu0=0 03 43 3.0 35 Test Statistic p Value 0.4 6 3.1 Student's t t 15.92794 Pr > It <.0001 sign m pr>= [MI <.0001 signed rank s pr>= IS| <.0001 distribution and probability plot for hatci hatch o d.o count normal quantilesrdtci: the univariate procedure variable: rdtci quantiles level quantile moments max n sum weights mean observations std deviation variance skewness kurtosis q3 uncorrected ss corrected coeff variation error median q1 basic statistical measures variability location min mode range interquartile extreme lowest highest note: displayed is smallest of modes with a value obs tests location: mu0="0" test statistic p student t pr> It] <.0001 sign m pr>= [MI <.0001 signed rank s pr>= |S| <.0001 distribution and probability plot for rdtci o rdtc count n normal quantiles>
Step by Step Solution
There are 3 Steps involved in it

Get step-by-step solutions from verified subject matter experts