

Question: Dataset for Assignment (inferential statistics).sav [DataSet 1] - IBM SPSS Statistics Data Editor File Edit View Data Transform Analyze Direct Marketing Graphs Utilities Add-ons Window
![Dataset for Assignment (inferential statistics).sav [DataSet 1] - IBM SPSS Statistics](https://dsd5zvtm8ll6.cloudfront.net/si.experts.images/questions/2024/09/66f041e103e1d_53666f041e096b5b.jpg)
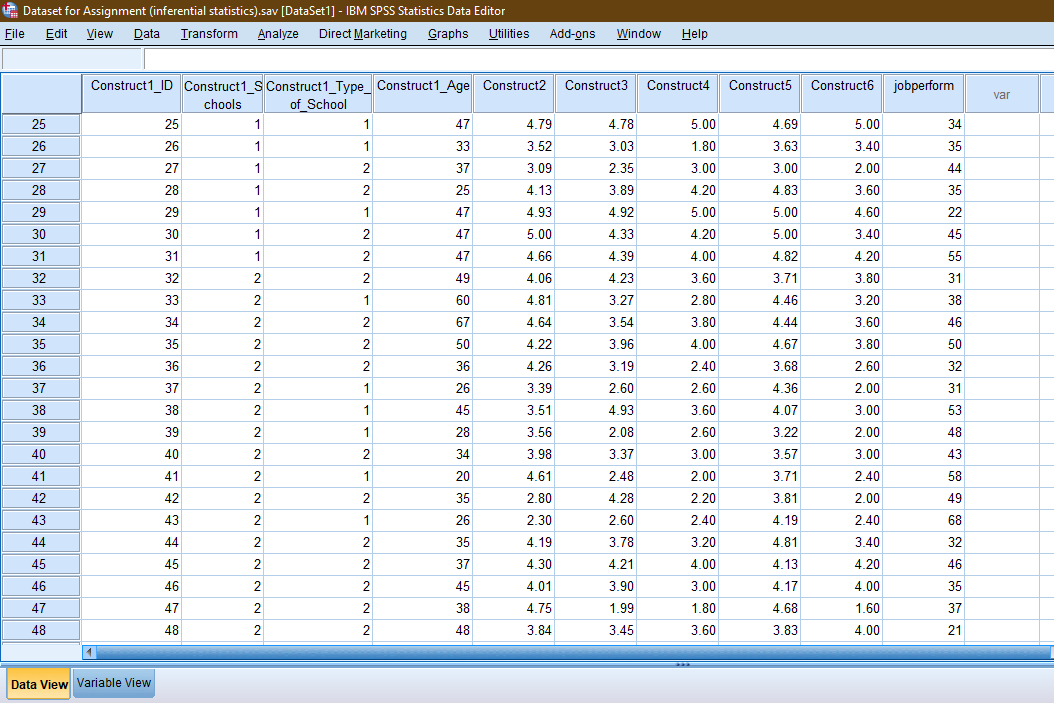
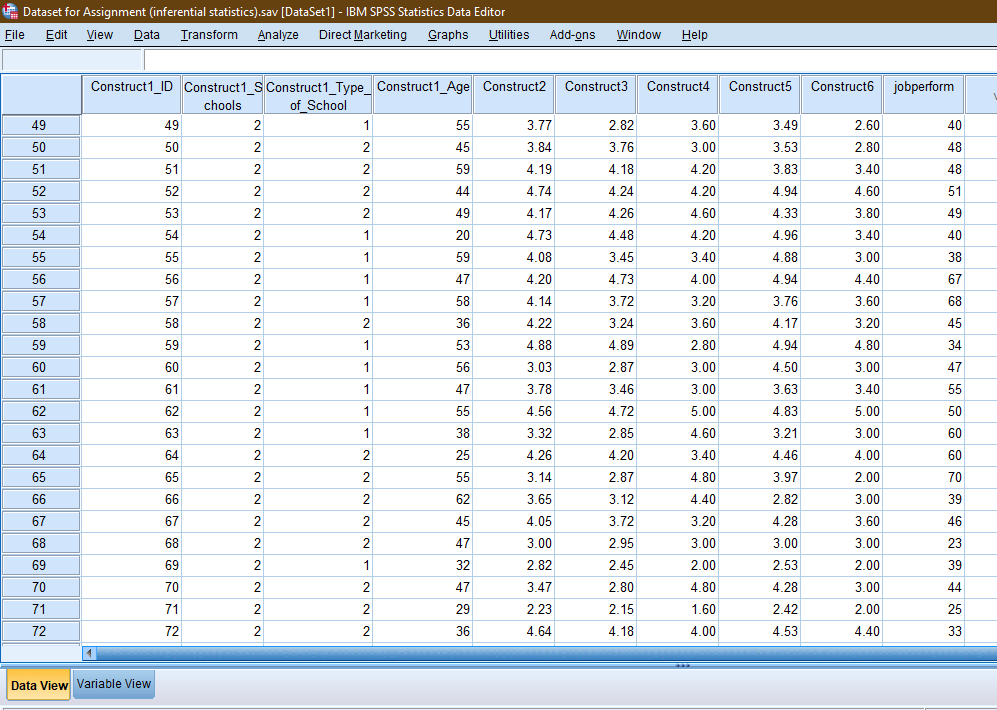
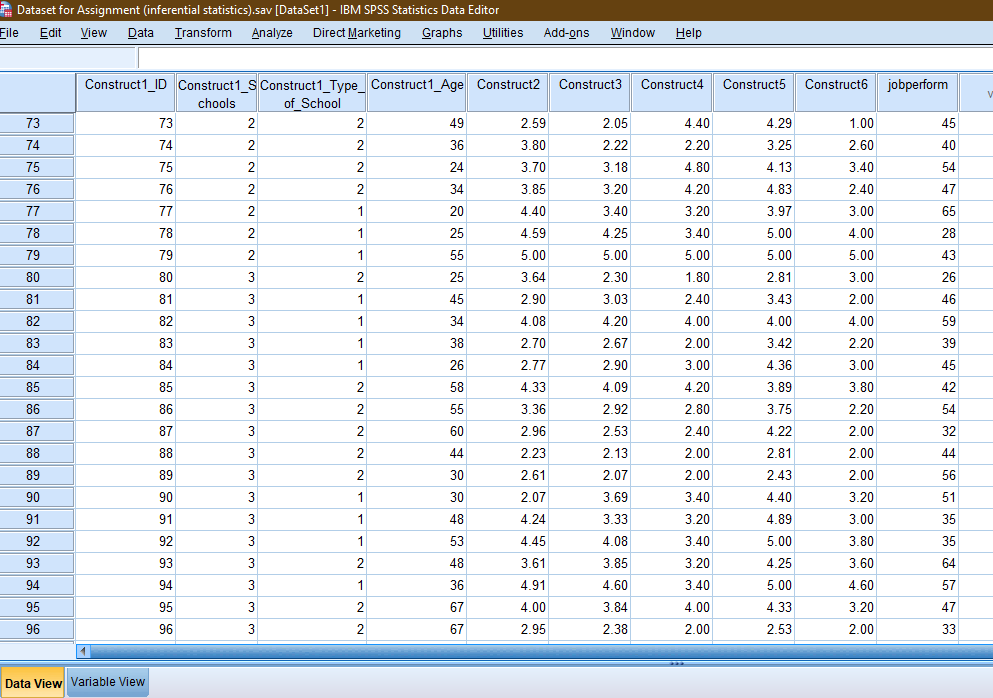
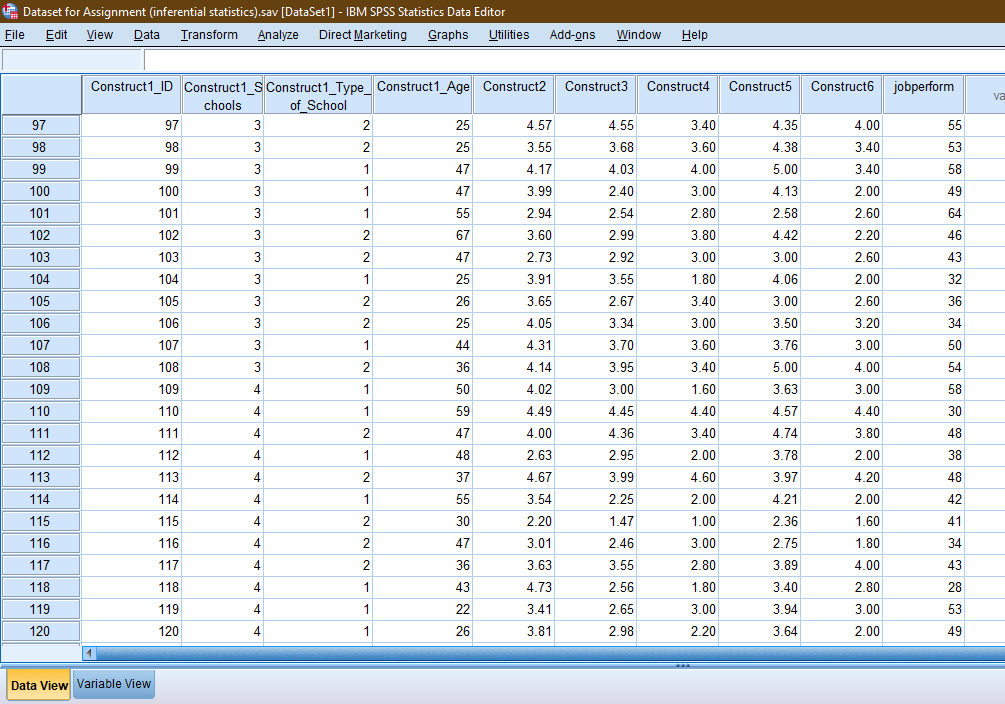
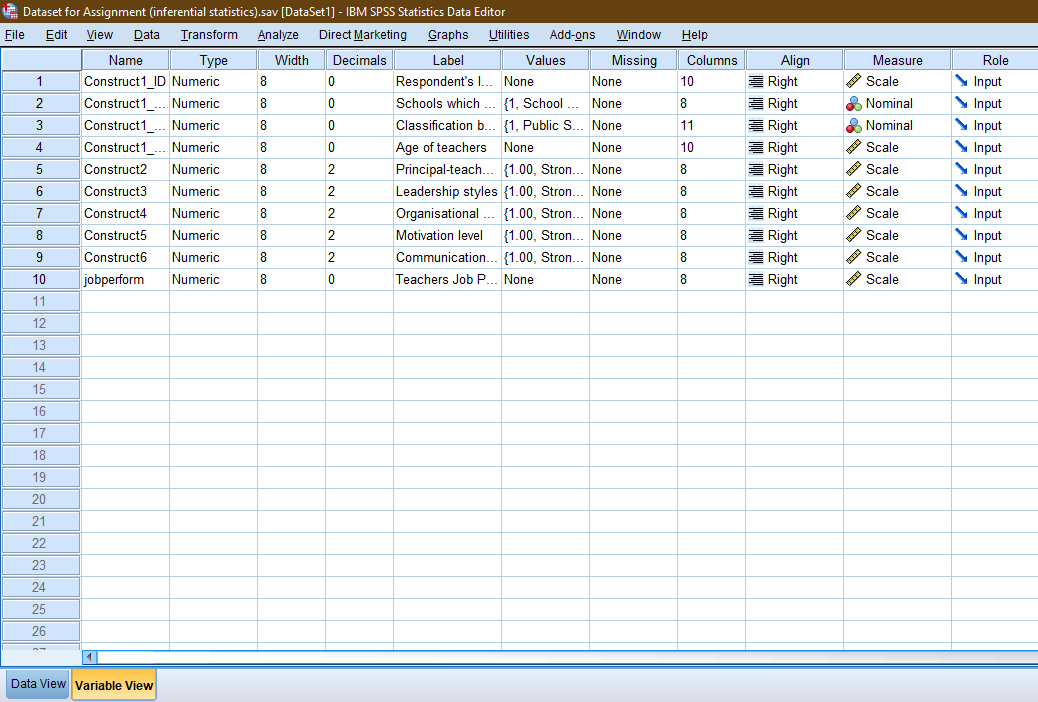
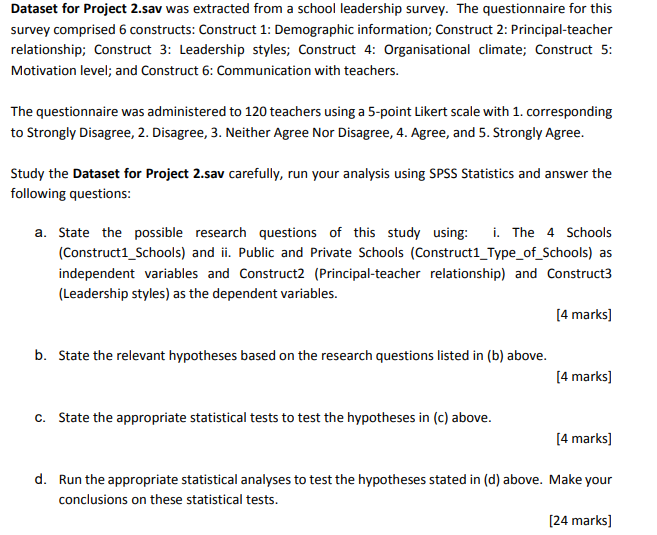
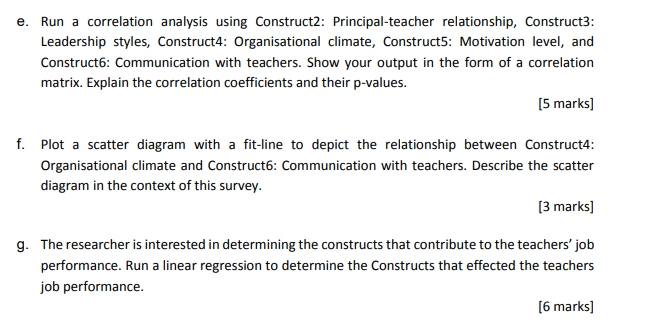
Dataset for Assignment (inferential statistics).sav [DataSet 1] - IBM SPSS Statistics Data Editor File Edit View Data Transform Analyze Direct Marketing Graphs Utilities Add-ons Window Help Construct4 Construct5 Construct jobperform 1 2.80 41 2 34 3 56 2.99 4.25 3.72 4.25 4.06 3.68 4 59 5 46 6 43 7 4.39 39 46 8 4.38 9 9 61 4.83 3.29 10 46 2.20 2.60 1.00 3.40 3.80 3.20 3.00 2.40 4.80 3.20 3.60 3.60 3.80 3.20 2.80 3.80 3.20 3.20 2.00 3.00 11 4.94 Construct1_ID Construct1_s Construct1_Type_Construct1_Age Construct2 Construct3 chools of School 1 1 2 38 4.60 4.48 2 1 1 2 56 4.24 4.91 3 1 2 49 4.15 4.30 4 1 1 38 3.44 3.23 5 1 2 30 4.13 3.40 6 1 2 36 4.55 3.17 7 1 1 40 4.19 4.23 8 1 2 37 4.57 3.10 9 1 2 44 4.64 4.71 10 1 1 25 4.46 2.95 11 1 1 45 4.27 3.61 12 1 2 56 4.41 4.38 13 1 1 47 4.71 4.87 14 1 1 36 3.50 3.05 15 1 1 1 47 3.75 3.47 16 1 2 38 3.73 4.00 17 1 1 27 4.14 3.33 18 1 1 1 55 3.13 2.66 19 1 1 59 3.27 2.23 20 1 1 1 35 3.78 3.58 21 1 1 54 4.22 4.00 22 1 1 36 3.63 3.52 23 1 2 34 3.26 2.70 24 1 2 36 4.04 3.56 39 12 33 13 2.80 2.00 3.40 3.00 3.00 4.40 3.00 4.80 2.40 3.80 4.00 4.60 2.40 3.20 4.00 3.40 2.40 2.00 3.40 4.00 3.60 2.00 3.80 58 14 57 15 58 16 38 44 17 3.99 4.61 3.36 3.79 3.04 4.72 3.75 2.93 3.04 3.89 3.94 2.99 4.38 18 39 19 48 33 20 21 40 22 30 3.60 3.40 4.40 3.20 23 32 24 67 Data View Variable View Dataset for Assignment (inferential statistics).sav [DataSet 1] - IBM SPSS Statistics Data Editor File Edit View Data Transform Analyze Direct Marketing Graphs Utilities Add-ons Window Help Construct4 Construct5 Construct jobperform var 25 4.69 34 5.00 1.80 35 26 27 3.63 3.00 44 28 35 29 22 30 45 55 31 32 31 33 4.83 5.00 5.00 4.82 3.71 4.46 4.44 4.67 3.68 4.36 38 46 34 35 Construct1_ID Construct1_s Construct1_type_Construct1_Age Construct2 Construct3 chools of_School 25 1 1 47 4.79 4.78 26 1 1 33 3.52 3.03 27 1 2 37 3.09 2.35 28 1 2 25 4.13 3.89 29 1 1 47 4.93 4.92 30 1 2 47 5.00 4.33 31 1 2 47 4.66 4.39 32 2 2 49 4.06 4.23 33 2 1 60 4.81 3.27 34 2 2 67 4.64 3.54 35 2 2 50 4.22 3.96 36 2 2 36 4.26 3.19 37 2 1 26 3.39 2.60 38 2 1 45 3.51 4.93 39 2 1 28 3.56 2.08 40 2 2 34 3.98 3.37 41 2 1 20 4.61 2.48 42 2 2 35 2.80 4.28 43 2 1 26 2.30 2.60 44 2 2 35 4.19 3.78 45 2 2 37 4.30 4.21 46 2 2 45 4.01 3.90 47 2 2 38 4.75 1.99 48 2 2 48 3.84 3.45 3.00 4.20 5.00 4.20 4.00 3.60 2.80 3.80 4.00 2.40 2.60 3.60 2.60 3.00 2.00 2.20 50 36 32 5.00 3.40 2.00 3.60 4.60 3.40 4.20 3.80 3.20 3.60 3.80 2.60 2.00 3.00 2.00 3.00 2.40 2.00 2.40 3.40 4.20 4.00 1.60 4.00 37 31 38 53 48 39 40 41 43 4.07 3.22 3.57 3.71 3.81 4.19 4.81 58 42 49 43 68 44 32 45 46 2.40 3.20 4.00 3.00 1.80 3.60 46 35 4.13 4.17 4.68 3.83 37 47 48 21 Data View Variable View Dataset for Assignment (inferential statistics).sav [DataSet 1] - IBM SPSS Statistics Data Editor File Edit View Data Transform Analyze Direct Marketing Graphs Utilities Add-ons Window Help Construct3 Construct4 Construct5 Construct jobperform 49 2.82 40 2.60 2.80 50 48 51 3.60 3.00 4.20 4.20 4.60 3.49 3.53 3.83 4.94 4.33 48 52 3.40 4.60 3.80 51 53 49 54 40 4.20 3.40 4.00 55 56 57 38 4.96 4.88 4.94 3.76 4.17 3.40 3.00 4.40 67 3.20 68 45 58 59 34 Construct1_ID Construct1_s Construct1_Type_Construct1_Age Construct2 chools of_School 49 2 1 55 3.77 50 2 2 45 3.84 51 2 2 59 4.19 52 2 2 44 4.74 53 2 2 49 4.17 54 2 1 20 4.73 55 2 1 59 4.08 56 2 1 47 4.20 57 2 1 58 4.14 58 2 2 36 4.22 59 2 1 53 4.88 60 2 1 56 3.03 61 2 1 47 3.78 62 2 1 55 4.56 63 2 1 38 3.32 64 2 2 25 4.26 65 2 2 55 3.14 66 2 2 62 3.65 67 2 2 45 4.05 68 2 2 47 3.00 69 2 1 32 2.82 70 2 2 47 3.47 71 2 2 29 2.23 72 2 2 36 4.64 60 47 61 3.76 4.18 4.24 4.26 4.48 3.45 4.73 3.72 3.24 4.89 2.87 3.46 4.72 2.85 4.20 2.87 3.12 3.72 2.95 2.45 2.80 2.15 4.18 55 62 3.60 2.80 3.00 3.00 5.00 4.60 3.40 4.80 4.40 3.60 3.20 4.80 3.00 3.40 5.00 3.00 4.00 2.00 3.00 3.60 50 60 63 64 60 70 4.94 4.50 3.63 4.83 3.21 4.46 3.97 2.82 4.28 3.00 2.53 4.28 2.42 4.53 65 66 39 67 46 68 23 69 3.20 3.00 2.00 4.80 1.60 39 3.00 2.00 3.00 2.00 70 44 71 25 72 4.00 4.40 33 Data View Variable View Dataset for Assignment (inferential statistics).sav [DataSet 1] - IBM SPSS Statistics Data Editor File Edit View Data Transform Analyze Direct Marketing Graphs Utilities Add-ons Window Help Construct3 Construct Construct5 Construct jobperform V 73 4.40 45 74 3.80 4.29 3.25 4.13 40 75 54 76 2.05 2.22 3.18 3.20 3.40 4.25 5.00 47 65 77 78 28 79 43 80 26 46 59 39 Construct1_ID Construct1_s Construct1_Type_ Construct1_Age Construct2 chools of_School 73 2 2 49 2.59 74 2 2 36 75 2 2 24 3.70 76 2 2 34 3.85 77 2 1 20 4.40 78 2 1 25 4.59 79 2 1 55 5.00 80 3 2 25 3.64 81 3 1 45 2.90 82 3 1 34 4.08 83 3 1 38 2.70 84 3 1 26 2.77 85 3 2 58 4.33 86 3 2 55 3.36 87 3 2 60 2.96 88 3 2 44 2.23 89 3 2 30 2.61 90 3 1 30 2.07 91 3 1 48 4.24 92 3 1 53 4.45 93 3 2 48 3.61 94 3 3 1 36 4.91 95 3 2 67 4.00 96 3 2 67 2.95 81 82 83 84 85 86 87 88 2.30 3.03 4.20 2.67 2.90 4.09 2.92 2.53 2.13 2.20 4.80 4.20 3.20 3.40 5.00 1.80 2.40 4.00 2.00 3.00 4.20 2.80 2.40 2.00 2.00 3.40 3.20 3.40 3.20 4.83 3.97 5.00 5.00 2.81 3.43 4.00 3.42 4.36 3.89 3.75 4.22 2.81 2.43 4.40 4.89 45 1.00 2.60 3.40 2.40 3.00 4.00 5.00 3.00 2.00 4.00 2.20 3.00 3.80 2.20 2.00 2.00 2.00 3.20 3.00 3.80 3.60 4.60 3.20 2.00 42 54 32 44 89 2.07 56 51 90 91 92 93 94 95 96 3.69 3.33 4.08 3.85 4.60 35 35 64 5.00 4.25 5.00 4.33 2.53 57 3.40 4.00 2.00 3.84 2.38 47 33 Data View Variable View Dataset for Assignment (inferential statistics).sav [DataSet 1] - IBM SPSS Statistics Data Editor File Edit View Data Transform Analyze Direct Marketing Graphs Utilities Add-ons Window Help Construct3 Construct4 Construct5 Constructo jobperform va 4.55 55 3.68 53 4.03 58 49 64 46 97 98 99 100 101 102 103 104 105 106 107 108 109 2.40 2.54 2.99 2.92 3.55 2.67 3.34 3.70 3.40 3.60 4.00 3.00 2.80 3.80 3.00 1.80 3.40 3.00 3.60 3.40 43 4.00 3.40 3.40 2.00 2.60 2.20 2.60 2.00 2.60 3.20 3.00 4.00 3.00 32 36 34 Construct1_ID Construct1_s Construct1_Type_ Construct1_Age Construct2 chools of_School 97 3 2 25 4.57 98 3 2 25 3.55 99 3 1 47 4.17 100 3 1 47 3.99 101 3 1 55 2.94 102 3 2 67 3.60 103 3 2 47 2.73 104 3 1 25 3.91 105 3 2 26 3.65 106 3 2 2 25 4.05 107 3 1 44 4.31 108 3 2 36 4.14 109 4 1 50 4.02 110 4 1 59 4.49 111 4 2 47 4.00 112 4 1 48 2.63 113 4 2 37 4.67 114 4 1 55 3.54 115 4 2 30 2.20 116 4 2 47 3.01 117 4 4 2 36 3.63 118 4 1 43 4.73 119 4 4 1 22 3.41 120 4 1 26 3.81 4.35 4.38 5.00 4.13 2.58 4.42 3.00 4.06 3.00 3.50 3.76 5.00 3.63 4.57 4.74 3.78 3.97 4.21 2.36 2.75 50 3.95 54 58 1.60 4.40 3.40 2.00 110 111 112 113 30 48 38 48 114 42 3.00 4.45 4.36 2.95 3.99 2.25 1.47 2.46 3.55 2.56 2.65 2.98 4.60 2.00 1.00 3.00 4.40 3.80 2.00 4.20 2.00 1.60 1.80 4.00 2.80 3.00 2.00 41 115 116 117 118 119 34 43 28 2.80 1.80 3.00 2.20 3.89 3.40 3.94 3.64 53 120 49 Data View Variable View Help Columns 10 8 Leed 11 10 Dataset for Assignment (inferential statistics).sav [DataSet 1] - IBM SPSS Statistics Data Editor File Edit View Data Transform Analyze Direct Marketing Graphs Utilities Add-ons Window Name Type Width Decimals Label Values Missing 1 1 Construct1_ID Numeric 8 0 Respondent's I... None None 2 Construct 1_... Numeric 8 0 Schools which ... {1, School ... None 3 Construct1_... Numeric 8 0 Classification b... {1, Public S... None 4 Construct1_... Numeric 8 0 Age of teachers None None 5 Construct2 Numeric 8 2 Principal-teach... (1.00, Stron... None 6 Construct3 Numeric 8 2 Leadership styles (1.00, Stron... None 7 Construct4 Numeric 8 2 Organisational ... (1.00, Stron... None 8 Construct5 Numeric 8 2 Motivation level {1.00, Stron... None 9 9 Construct Numeric 8 2 Communication... {1.00, Stron... None 10 jobperform Numeric 8 0 Teachers Job P... None None 11 8 Align Right Right Right Right Right Right Right Right Right Right Measure Scale Nominal Nominal Scale Scale Scale Scale Scale Scale Scale Role Input Input Input Input Input Input Input Input Input Input 8 8 0 8 8 8 San 12 13 14 15 16 17 18 19 20 21 22 23 24 25 26 Data View Variable View Dataset for Project 2.sav was extracted from a school leadership survey. The questionnaire for this survey comprised 6 constructs: Construct 1: Demographic information; Construct 2: Principal-teacher relationship; Construct 3: Leadership styles; Construct 4: Organisational climate; Construct 5: Motivation level; and Construct 6: Communication with teachers. The questionnaire was administered to 120 teachers using a 5-point Likert scale with 1. corresponding to Strongly Disagree, 2. Disagree, 3. Neither Agree Nor Disagree, 4. Agree, and 5. Strongly Agree. Study the Dataset for Project 2.sav carefully, run your analysis using SPSS Statistics and answer the following questions: a. State the possible research questions of this study using: i. The 4 Schools (Construct1_Schools) and ii. Public and Private Schools (Construct1_Type_of_Schools) as independent variables and Construct2 (Principal-teacher relationship) and Construct3 (Leadership styles) as the dependent variables. [4 marks) b. State the relevant hypotheses based on the research questions listed in (b) above. [4 marks] C. State the appropriate statistical tests to test the hypotheses in (c) above. [4 marks) d. Run the appropriate statistical analyses to test the hypotheses stated in (d) above. Make your conclusions on these statistical tests. [24 marks] e. Run a correlation analysis using Construct2: Principal-teacher relationship, Construct3: Leadership styles, Construct4: Organisational climate, Construct5: Motivation level, and Construct6: Communication with teachers. Show your output in the form of a correlation matrix. Explain the correlation coefficients and their p-values. [5 marks] f. Plot a scatter diagram with a fit-line to depict the relationship between Construct4: Organisational climate and Constructo: Communication with teachers. Describe the scatter diagram in the context of this survey. [3 marks) g. The researcher is interested in determining the constructs that contribute to the teachers' job performance. Run a linear regression to determine the Constructs that effected the teachers job performance. [6 marks) Dataset for Assignment (inferential statistics).sav [DataSet 1] - IBM SPSS Statistics Data Editor File Edit View Data Transform Analyze Direct Marketing Graphs Utilities Add-ons Window Help Construct4 Construct5 Construct jobperform 1 2.80 41 2 34 3 56 2.99 4.25 3.72 4.25 4.06 3.68 4 59 5 46 6 43 7 4.39 39 46 8 4.38 9 9 61 4.83 3.29 10 46 2.20 2.60 1.00 3.40 3.80 3.20 3.00 2.40 4.80 3.20 3.60 3.60 3.80 3.20 2.80 3.80 3.20 3.20 2.00 3.00 11 4.94 Construct1_ID Construct1_s Construct1_Type_Construct1_Age Construct2 Construct3 chools of School 1 1 2 38 4.60 4.48 2 1 1 2 56 4.24 4.91 3 1 2 49 4.15 4.30 4 1 1 38 3.44 3.23 5 1 2 30 4.13 3.40 6 1 2 36 4.55 3.17 7 1 1 40 4.19 4.23 8 1 2 37 4.57 3.10 9 1 2 44 4.64 4.71 10 1 1 25 4.46 2.95 11 1 1 45 4.27 3.61 12 1 2 56 4.41 4.38 13 1 1 47 4.71 4.87 14 1 1 36 3.50 3.05 15 1 1 1 47 3.75 3.47 16 1 2 38 3.73 4.00 17 1 1 27 4.14 3.33 18 1 1 1 55 3.13 2.66 19 1 1 59 3.27 2.23 20 1 1 1 35 3.78 3.58 21 1 1 54 4.22 4.00 22 1 1 36 3.63 3.52 23 1 2 34 3.26 2.70 24 1 2 36 4.04 3.56 39 12 33 13 2.80 2.00 3.40 3.00 3.00 4.40 3.00 4.80 2.40 3.80 4.00 4.60 2.40 3.20 4.00 3.40 2.40 2.00 3.40 4.00 3.60 2.00 3.80 58 14 57 15 58 16 38 44 17 3.99 4.61 3.36 3.79 3.04 4.72 3.75 2.93 3.04 3.89 3.94 2.99 4.38 18 39 19 48 33 20 21 40 22 30 3.60 3.40 4.40 3.20 23 32 24 67 Data View Variable View Dataset for Assignment (inferential statistics).sav [DataSet 1] - IBM SPSS Statistics Data Editor File Edit View Data Transform Analyze Direct Marketing Graphs Utilities Add-ons Window Help Construct4 Construct5 Construct jobperform var 25 4.69 34 5.00 1.80 35 26 27 3.63 3.00 44 28 35 29 22 30 45 55 31 32 31 33 4.83 5.00 5.00 4.82 3.71 4.46 4.44 4.67 3.68 4.36 38 46 34 35 Construct1_ID Construct1_s Construct1_type_Construct1_Age Construct2 Construct3 chools of_School 25 1 1 47 4.79 4.78 26 1 1 33 3.52 3.03 27 1 2 37 3.09 2.35 28 1 2 25 4.13 3.89 29 1 1 47 4.93 4.92 30 1 2 47 5.00 4.33 31 1 2 47 4.66 4.39 32 2 2 49 4.06 4.23 33 2 1 60 4.81 3.27 34 2 2 67 4.64 3.54 35 2 2 50 4.22 3.96 36 2 2 36 4.26 3.19 37 2 1 26 3.39 2.60 38 2 1 45 3.51 4.93 39 2 1 28 3.56 2.08 40 2 2 34 3.98 3.37 41 2 1 20 4.61 2.48 42 2 2 35 2.80 4.28 43 2 1 26 2.30 2.60 44 2 2 35 4.19 3.78 45 2 2 37 4.30 4.21 46 2 2 45 4.01 3.90 47 2 2 38 4.75 1.99 48 2 2 48 3.84 3.45 3.00 4.20 5.00 4.20 4.00 3.60 2.80 3.80 4.00 2.40 2.60 3.60 2.60 3.00 2.00 2.20 50 36 32 5.00 3.40 2.00 3.60 4.60 3.40 4.20 3.80 3.20 3.60 3.80 2.60 2.00 3.00 2.00 3.00 2.40 2.00 2.40 3.40 4.20 4.00 1.60 4.00 37 31 38 53 48 39 40 41 43 4.07 3.22 3.57 3.71 3.81 4.19 4.81 58 42 49 43 68 44 32 45 46 2.40 3.20 4.00 3.00 1.80 3.60 46 35 4.13 4.17 4.68 3.83 37 47 48 21 Data View Variable View Dataset for Assignment (inferential statistics).sav [DataSet 1] - IBM SPSS Statistics Data Editor File Edit View Data Transform Analyze Direct Marketing Graphs Utilities Add-ons Window Help Construct3 Construct4 Construct5 Construct jobperform 49 2.82 40 2.60 2.80 50 48 51 3.60 3.00 4.20 4.20 4.60 3.49 3.53 3.83 4.94 4.33 48 52 3.40 4.60 3.80 51 53 49 54 40 4.20 3.40 4.00 55 56 57 38 4.96 4.88 4.94 3.76 4.17 3.40 3.00 4.40 67 3.20 68 45 58 59 34 Construct1_ID Construct1_s Construct1_Type_Construct1_Age Construct2 chools of_School 49 2 1 55 3.77 50 2 2 45 3.84 51 2 2 59 4.19 52 2 2 44 4.74 53 2 2 49 4.17 54 2 1 20 4.73 55 2 1 59 4.08 56 2 1 47 4.20 57 2 1 58 4.14 58 2 2 36 4.22 59 2 1 53 4.88 60 2 1 56 3.03 61 2 1 47 3.78 62 2 1 55 4.56 63 2 1 38 3.32 64 2 2 25 4.26 65 2 2 55 3.14 66 2 2 62 3.65 67 2 2 45 4.05 68 2 2 47 3.00 69 2 1 32 2.82 70 2 2 47 3.47 71 2 2 29 2.23 72 2 2 36 4.64 60 47 61 3.76 4.18 4.24 4.26 4.48 3.45 4.73 3.72 3.24 4.89 2.87 3.46 4.72 2.85 4.20 2.87 3.12 3.72 2.95 2.45 2.80 2.15 4.18 55 62 3.60 2.80 3.00 3.00 5.00 4.60 3.40 4.80 4.40 3.60 3.20 4.80 3.00 3.40 5.00 3.00 4.00 2.00 3.00 3.60 50 60 63 64 60 70 4.94 4.50 3.63 4.83 3.21 4.46 3.97 2.82 4.28 3.00 2.53 4.28 2.42 4.53 65 66 39 67 46 68 23 69 3.20 3.00 2.00 4.80 1.60 39 3.00 2.00 3.00 2.00 70 44 71 25 72 4.00 4.40 33 Data View Variable View Dataset for Assignment (inferential statistics).sav [DataSet 1] - IBM SPSS Statistics Data Editor File Edit View Data Transform Analyze Direct Marketing Graphs Utilities Add-ons Window Help Construct3 Construct Construct5 Construct jobperform V 73 4.40 45 74 3.80 4.29 3.25 4.13 40 75 54 76 2.05 2.22 3.18 3.20 3.40 4.25 5.00 47 65 77 78 28 79 43 80 26 46 59 39 Construct1_ID Construct1_s Construct1_Type_ Construct1_Age Construct2 chools of_School 73 2 2 49 2.59 74 2 2 36 75 2 2 24 3.70 76 2 2 34 3.85 77 2 1 20 4.40 78 2 1 25 4.59 79 2 1 55 5.00 80 3 2 25 3.64 81 3 1 45 2.90 82 3 1 34 4.08 83 3 1 38 2.70 84 3 1 26 2.77 85 3 2 58 4.33 86 3 2 55 3.36 87 3 2 60 2.96 88 3 2 44 2.23 89 3 2 30 2.61 90 3 1 30 2.07 91 3 1 48 4.24 92 3 1 53 4.45 93 3 2 48 3.61 94 3 3 1 36 4.91 95 3 2 67 4.00 96 3 2 67 2.95 81 82 83 84 85 86 87 88 2.30 3.03 4.20 2.67 2.90 4.09 2.92 2.53 2.13 2.20 4.80 4.20 3.20 3.40 5.00 1.80 2.40 4.00 2.00 3.00 4.20 2.80 2.40 2.00 2.00 3.40 3.20 3.40 3.20 4.83 3.97 5.00 5.00 2.81 3.43 4.00 3.42 4.36 3.89 3.75 4.22 2.81 2.43 4.40 4.89 45 1.00 2.60 3.40 2.40 3.00 4.00 5.00 3.00 2.00 4.00 2.20 3.00 3.80 2.20 2.00 2.00 2.00 3.20 3.00 3.80 3.60 4.60 3.20 2.00 42 54 32 44 89 2.07 56 51 90 91 92 93 94 95 96 3.69 3.33 4.08 3.85 4.60 35 35 64 5.00 4.25 5.00 4.33 2.53 57 3.40 4.00 2.00 3.84 2.38 47 33 Data View Variable View Dataset for Assignment (inferential statistics).sav [DataSet 1] - IBM SPSS Statistics Data Editor File Edit View Data Transform Analyze Direct Marketing Graphs Utilities Add-ons Window Help Construct3 Construct4 Construct5 Constructo jobperform va 4.55 55 3.68 53 4.03 58 49 64 46 97 98 99 100 101 102 103 104 105 106 107 108 109 2.40 2.54 2.99 2.92 3.55 2.67 3.34 3.70 3.40 3.60 4.00 3.00 2.80 3.80 3.00 1.80 3.40 3.00 3.60 3.40 43 4.00 3.40 3.40 2.00 2.60 2.20 2.60 2.00 2.60 3.20 3.00 4.00 3.00 32 36 34 Construct1_ID Construct1_s Construct1_Type_ Construct1_Age Construct2 chools of_School 97 3 2 25 4.57 98 3 2 25 3.55 99 3 1 47 4.17 100 3 1 47 3.99 101 3 1 55 2.94 102 3 2 67 3.60 103 3 2 47 2.73 104 3 1 25 3.91 105 3 2 26 3.65 106 3 2 2 25 4.05 107 3 1 44 4.31 108 3 2 36 4.14 109 4 1 50 4.02 110 4 1 59 4.49 111 4 2 47 4.00 112 4 1 48 2.63 113 4 2 37 4.67 114 4 1 55 3.54 115 4 2 30 2.20 116 4 2 47 3.01 117 4 4 2 36 3.63 118 4 1 43 4.73 119 4 4 1 22 3.41 120 4 1 26 3.81 4.35 4.38 5.00 4.13 2.58 4.42 3.00 4.06 3.00 3.50 3.76 5.00 3.63 4.57 4.74 3.78 3.97 4.21 2.36 2.75 50 3.95 54 58 1.60 4.40 3.40 2.00 110 111 112 113 30 48 38 48 114 42 3.00 4.45 4.36 2.95 3.99 2.25 1.47 2.46 3.55 2.56 2.65 2.98 4.60 2.00 1.00 3.00 4.40 3.80 2.00 4.20 2.00 1.60 1.80 4.00 2.80 3.00 2.00 41 115 116 117 118 119 34 43 28 2.80 1.80 3.00 2.20 3.89 3.40 3.94 3.64 53 120 49 Data View Variable View Help Columns 10 8 Leed 11 10 Dataset for Assignment (inferential statistics).sav [DataSet 1] - IBM SPSS Statistics Data Editor File Edit View Data Transform Analyze Direct Marketing Graphs Utilities Add-ons Window Name Type Width Decimals Label Values Missing 1 1 Construct1_ID Numeric 8 0 Respondent's I... None None 2 Construct 1_... Numeric 8 0 Schools which ... {1, School ... None 3 Construct1_... Numeric 8 0 Classification b... {1, Public S... None 4 Construct1_... Numeric 8 0 Age of teachers None None 5 Construct2 Numeric 8 2 Principal-teach... (1.00, Stron... None 6 Construct3 Numeric 8 2 Leadership styles (1.00, Stron... None 7 Construct4 Numeric 8 2 Organisational ... (1.00, Stron... None 8 Construct5 Numeric 8 2 Motivation level {1.00, Stron... None 9 9 Construct Numeric 8 2 Communication... {1.00, Stron... None 10 jobperform Numeric 8 0 Teachers Job P... None None 11 8 Align Right Right Right Right Right Right Right Right Right Right Measure Scale Nominal Nominal Scale Scale Scale Scale Scale Scale Scale Role Input Input Input Input Input Input Input Input Input Input 8 8 0 8 8 8 San 12 13 14 15 16 17 18 19 20 21 22 23 24 25 26 Data View Variable View Dataset for Project 2.sav was extracted from a school leadership survey. The questionnaire for this survey comprised 6 constructs: Construct 1: Demographic information; Construct 2: Principal-teacher relationship; Construct 3: Leadership styles; Construct 4: Organisational climate; Construct 5: Motivation level; and Construct 6: Communication with teachers. The questionnaire was administered to 120 teachers using a 5-point Likert scale with 1. corresponding to Strongly Disagree, 2. Disagree, 3. Neither Agree Nor Disagree, 4. Agree, and 5. Strongly Agree. Study the Dataset for Project 2.sav carefully, run your analysis using SPSS Statistics and answer the following questions: a. State the possible research questions of this study using: i. The 4 Schools (Construct1_Schools) and ii. Public and Private Schools (Construct1_Type_of_Schools) as independent variables and Construct2 (Principal-teacher relationship) and Construct3 (Leadership styles) as the dependent variables. [4 marks) b. State the relevant hypotheses based on the research questions listed in (b) above. [4 marks] C. State the appropriate statistical tests to test the hypotheses in (c) above. [4 marks) d. Run the appropriate statistical analyses to test the hypotheses stated in (d) above. Make your conclusions on these statistical tests. [24 marks] e. Run a correlation analysis using Construct2: Principal-teacher relationship, Construct3: Leadership styles, Construct4: Organisational climate, Construct5: Motivation level, and Construct6: Communication with teachers. Show your output in the form of a correlation matrix. Explain the correlation coefficients and their p-values. [5 marks] f. Plot a scatter diagram with a fit-line to depict the relationship between Construct4: Organisational climate and Constructo: Communication with teachers. Describe the scatter diagram in the context of this survey. [3 marks) g. The researcher is interested in determining the constructs that contribute to the teachers' job performance. Run a linear regression to determine the Constructs that effected the teachers job performance. [6 marks)
Step by Step Solution
There are 3 Steps involved in it

Get step-by-step solutions from verified subject matter experts