

Question: Dataset Generation: First we are going to generate the data which can be used in our experimentation. We are going to assume that the data
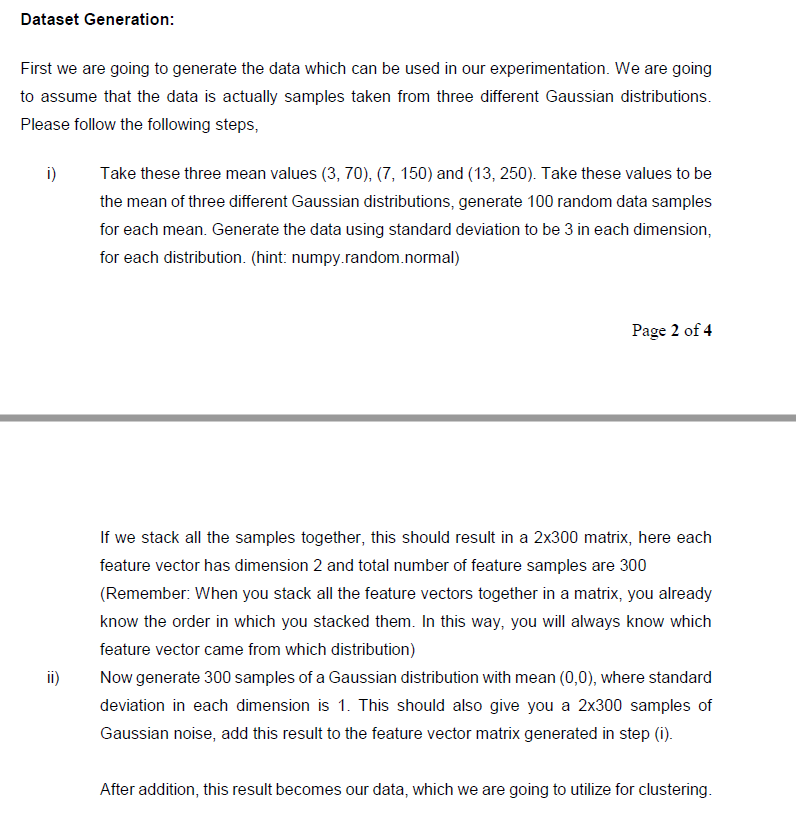
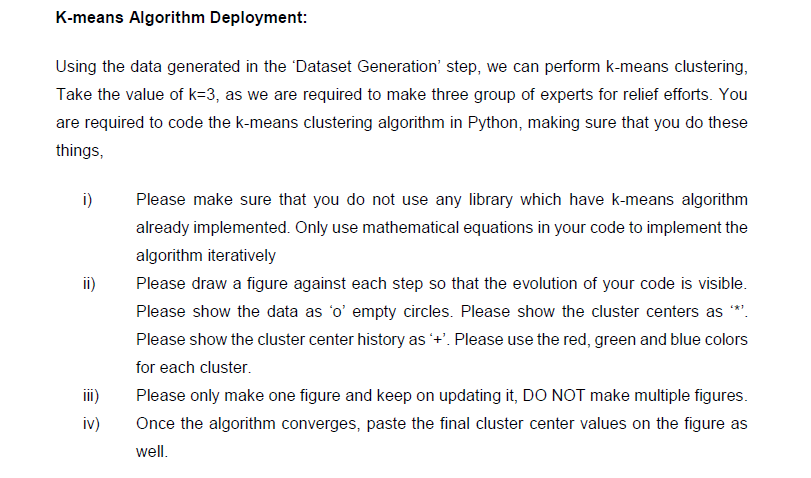
Dataset Generation: First we are going to generate the data which can be used in our experimentation. We are going to assume that the data is actually samples taken from three different Gaussian distributions. Please follow the following steps, i) Take these three mean values (3, 70), (7, 150) and (13,250). Take these values to be the mean of three different Gaussian distributions, generate 100 random data samples for each mean. Generate the data using standard deviation to be 3 in each dimension, for each distribution. (hint: numpy.random.normal) Page 2 of 4 If we stack all the samples together, this should result in a 2x300 matrix, here each feature vector has dimension 2 and total number of feature samples are 300 (Remember: When you stack all the feature vectors together in a matrix, you already know the order in which you stacked them. In this way, you will always know which feature vector came from which distribution) Now generate 300 samples of a Gaussian distribution with mean (0,0), where standard deviation in each dimension is 1. This should also give you a 2x300 samples of Gaussian noise, add this result to the feature vector matrix generated in step (i). After addition, this result becomes our data, which we are going to utilize for clustering. K-means Algorithm Deployment: Using the data generated in the 'Dataset Generation' step, we can perform k-means clustering, Take the value of k=3, as we are required to make three group of experts for relief efforts. You are required to code the k-means clustering algorithm in Python, making sure that you do these things, i) Please make sure that you do not use any library which have k-means algorithm already implemented. Only use mathematical equations in your code to implement the algorithm iteratively Please draw a figure against each step so that the evolution of your code is visible. Please show the data as 'o' empty circles. Please show the cluster centers as Please show the cluster center history as '+'. Please use the red, green and blue colors for each cluster Please only make one figure and keep on updating it, DO NOT make multiple figures. Once the algorithm converges, paste the final cluster center values on the figure as well. iii) iv) Dataset Generation: First we are going to generate the data which can be used in our experimentation. We are going to assume that the data is actually samples taken from three different Gaussian distributions. Please follow the following steps, i) Take these three mean values (3, 70), (7, 150) and (13,250). Take these values to be the mean of three different Gaussian distributions, generate 100 random data samples for each mean. Generate the data using standard deviation to be 3 in each dimension, for each distribution. (hint: numpy.random.normal) Page 2 of 4 If we stack all the samples together, this should result in a 2x300 matrix, here each feature vector has dimension 2 and total number of feature samples are 300 (Remember: When you stack all the feature vectors together in a matrix, you already know the order in which you stacked them. In this way, you will always know which feature vector came from which distribution) Now generate 300 samples of a Gaussian distribution with mean (0,0), where standard deviation in each dimension is 1. This should also give you a 2x300 samples of Gaussian noise, add this result to the feature vector matrix generated in step (i). After addition, this result becomes our data, which we are going to utilize for clustering. K-means Algorithm Deployment: Using the data generated in the 'Dataset Generation' step, we can perform k-means clustering, Take the value of k=3, as we are required to make three group of experts for relief efforts. You are required to code the k-means clustering algorithm in Python, making sure that you do these things, i) Please make sure that you do not use any library which have k-means algorithm already implemented. Only use mathematical equations in your code to implement the algorithm iteratively Please draw a figure against each step so that the evolution of your code is visible. Please show the data as 'o' empty circles. Please show the cluster centers as Please show the cluster center history as '+'. Please use the red, green and blue colors for each cluster Please only make one figure and keep on updating it, DO NOT make multiple figures. Once the algorithm converges, paste the final cluster center values on the figure as well. iii) iv)
Step by Step Solution
There are 3 Steps involved in it

Get step-by-step solutions from verified subject matter experts