

Question: dataset is called birdsongs.data We can create density plots that compare frequencies across both the identity and treatment columns of our full dataset. Make two
dataset is called birdsongs.data 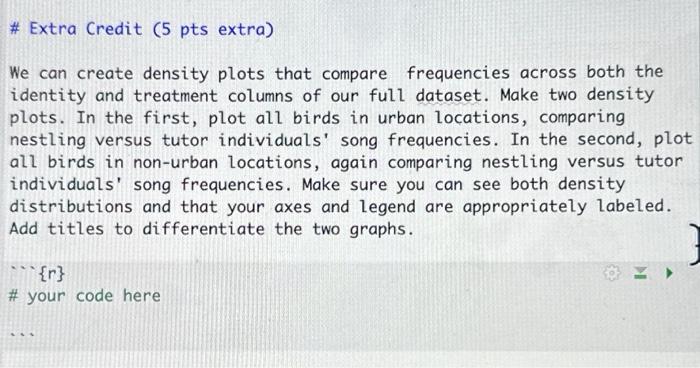
We can create density plots that compare frequencies across both the identity and treatment columns of our full dataset. Make two density plots. In the first, plot all birds in urban locations, comparing nestling versus tutor individuals' song frequencies. In the second, plot all birds in non-urban locations, again comparing nestling versus tutor individuals' song frequencies. Make sure you can see both density distributions and that your axes and legend are appropriately labeled. Add titles to differentiate the two graphs
Step by Step Solution
There are 3 Steps involved in it
1 Expert Approved Answer
Step: 1 Unlock

Question Has Been Solved by an Expert!
Get step-by-step solutions from verified subject matter experts
Step: 2 Unlock
Step: 3 Unlock